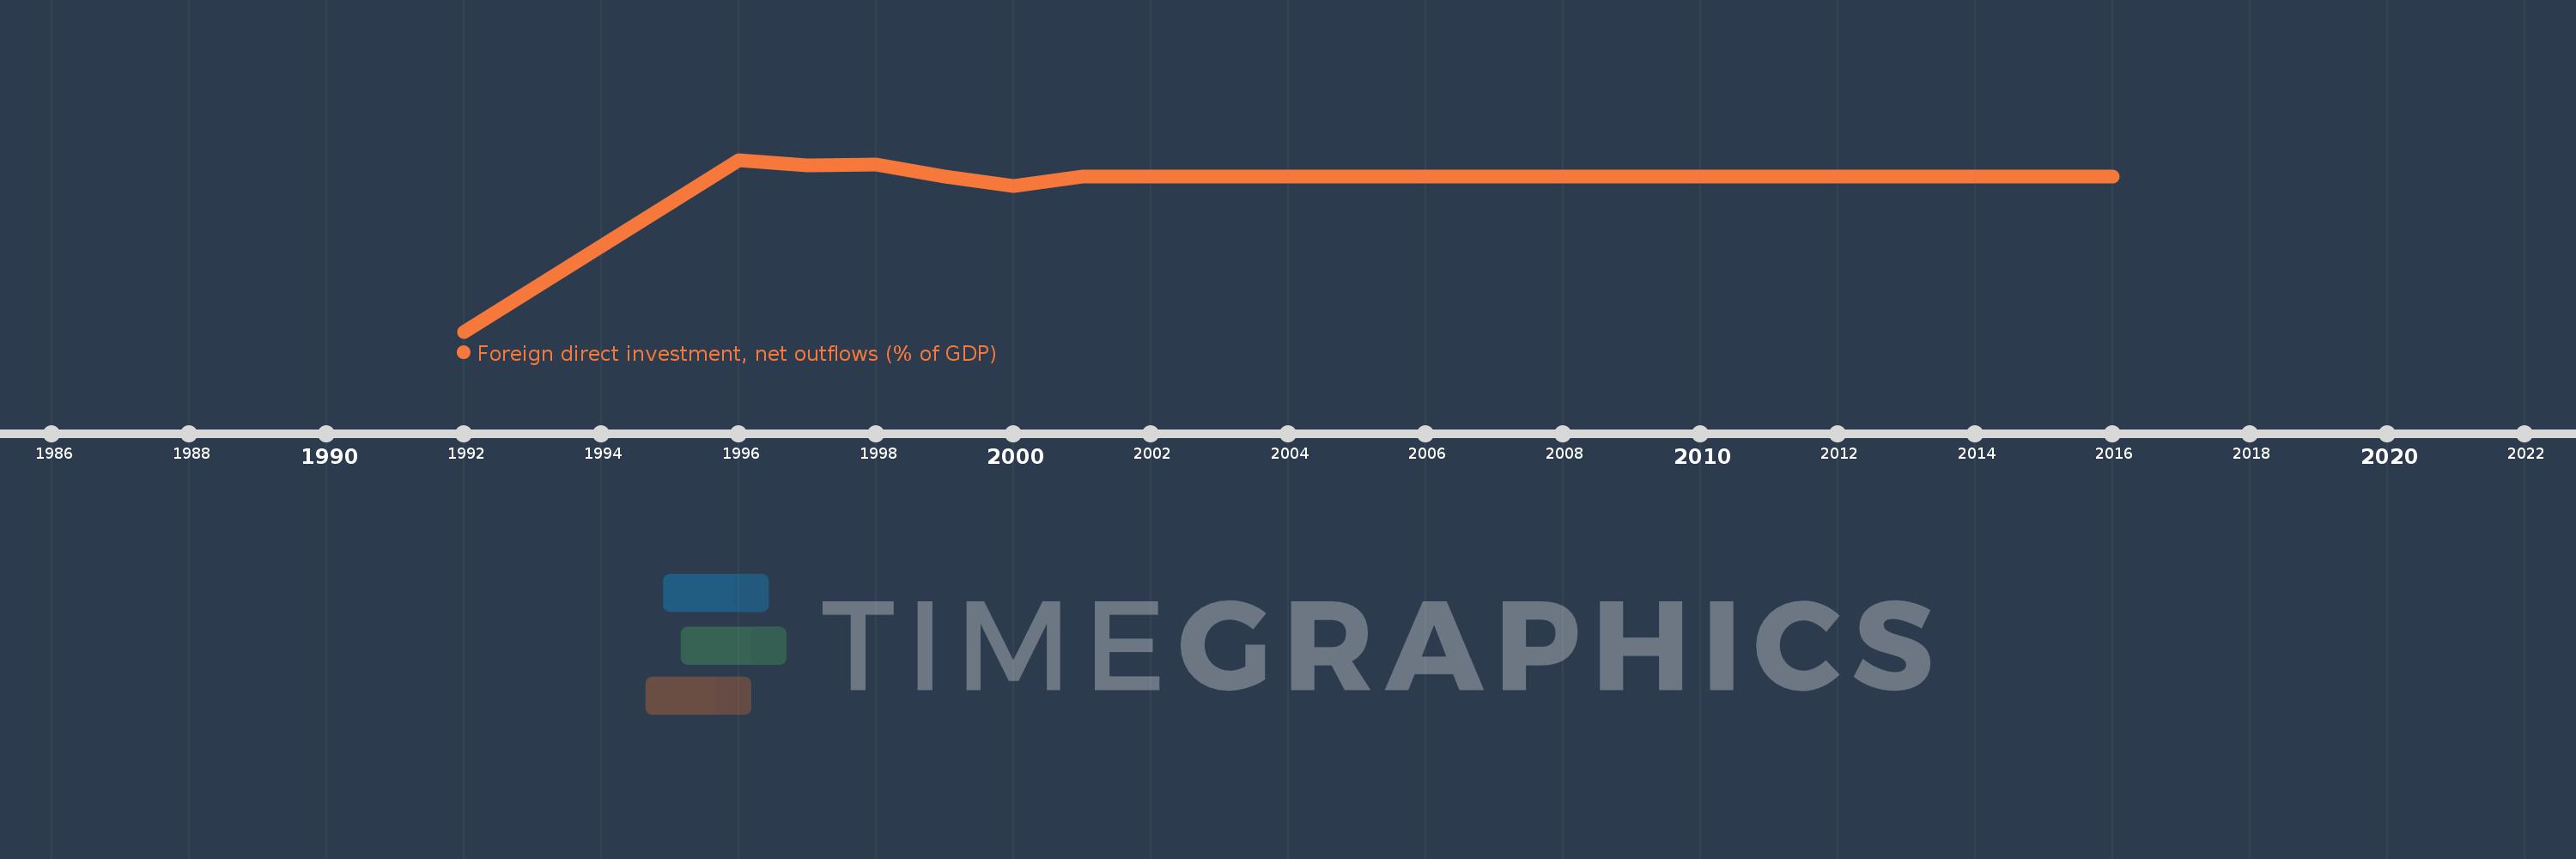
This timeline shows a graph from 1992 to 2016 of Haiti. No data until 1991. Number of actual observations by date: 18.
Source name:
World Development Indicators
Source organization:
International Monetary Fund, International Financial Statistics and Balance of Payments databases, World Bank, International Debt Statistics, and World Bank and OECD GDP estimates.
Categories, topics:
Economy & Growth, Financial Sector
Last updated:
apr 23, 2017
Indicators value changes by year
Meaning:
-0.018
Minimum:
-0.392
jan 1, 1992
Maximum:
0.043
jan 1, 1996
At the date of observation
Value
Absolute change
Change from the previous value
jan 1, 1992
-0.392
-0.392
0.0%
jan 1, 1996
0.043
+0.434
-110.9%
jan 1, 1997
0.028
-0.015
-35.15%
jan 1, 1998
0.03
+0.002
8.24%
jan 1, 1999
0.0
-0.03
-100.0%
jan 1, 2000
-0.024
-0.024
%
jan 1, 2001
0.0
+0.024
-100.0%
jan 1, 2006
0.0
0.0
%
jan 1, 2007
0.0
0.0
%
jan 1, 2008
0.0
0.0
%
jan 1, 2009
0.0
0.0
%
jan 1, 2010
0.0
0.0
%
jan 1, 2011
0.0
0.0
%
jan 1, 2012
0.0
0.0
%
jan 1, 2013
0.0
0.0
%
jan 1, 2014
0.0
0.0
%
jan 1, 2015
0.0
0.0
%
jan 1, 2016
0.0
0.0
%
Ranking of countries by current statistics by years