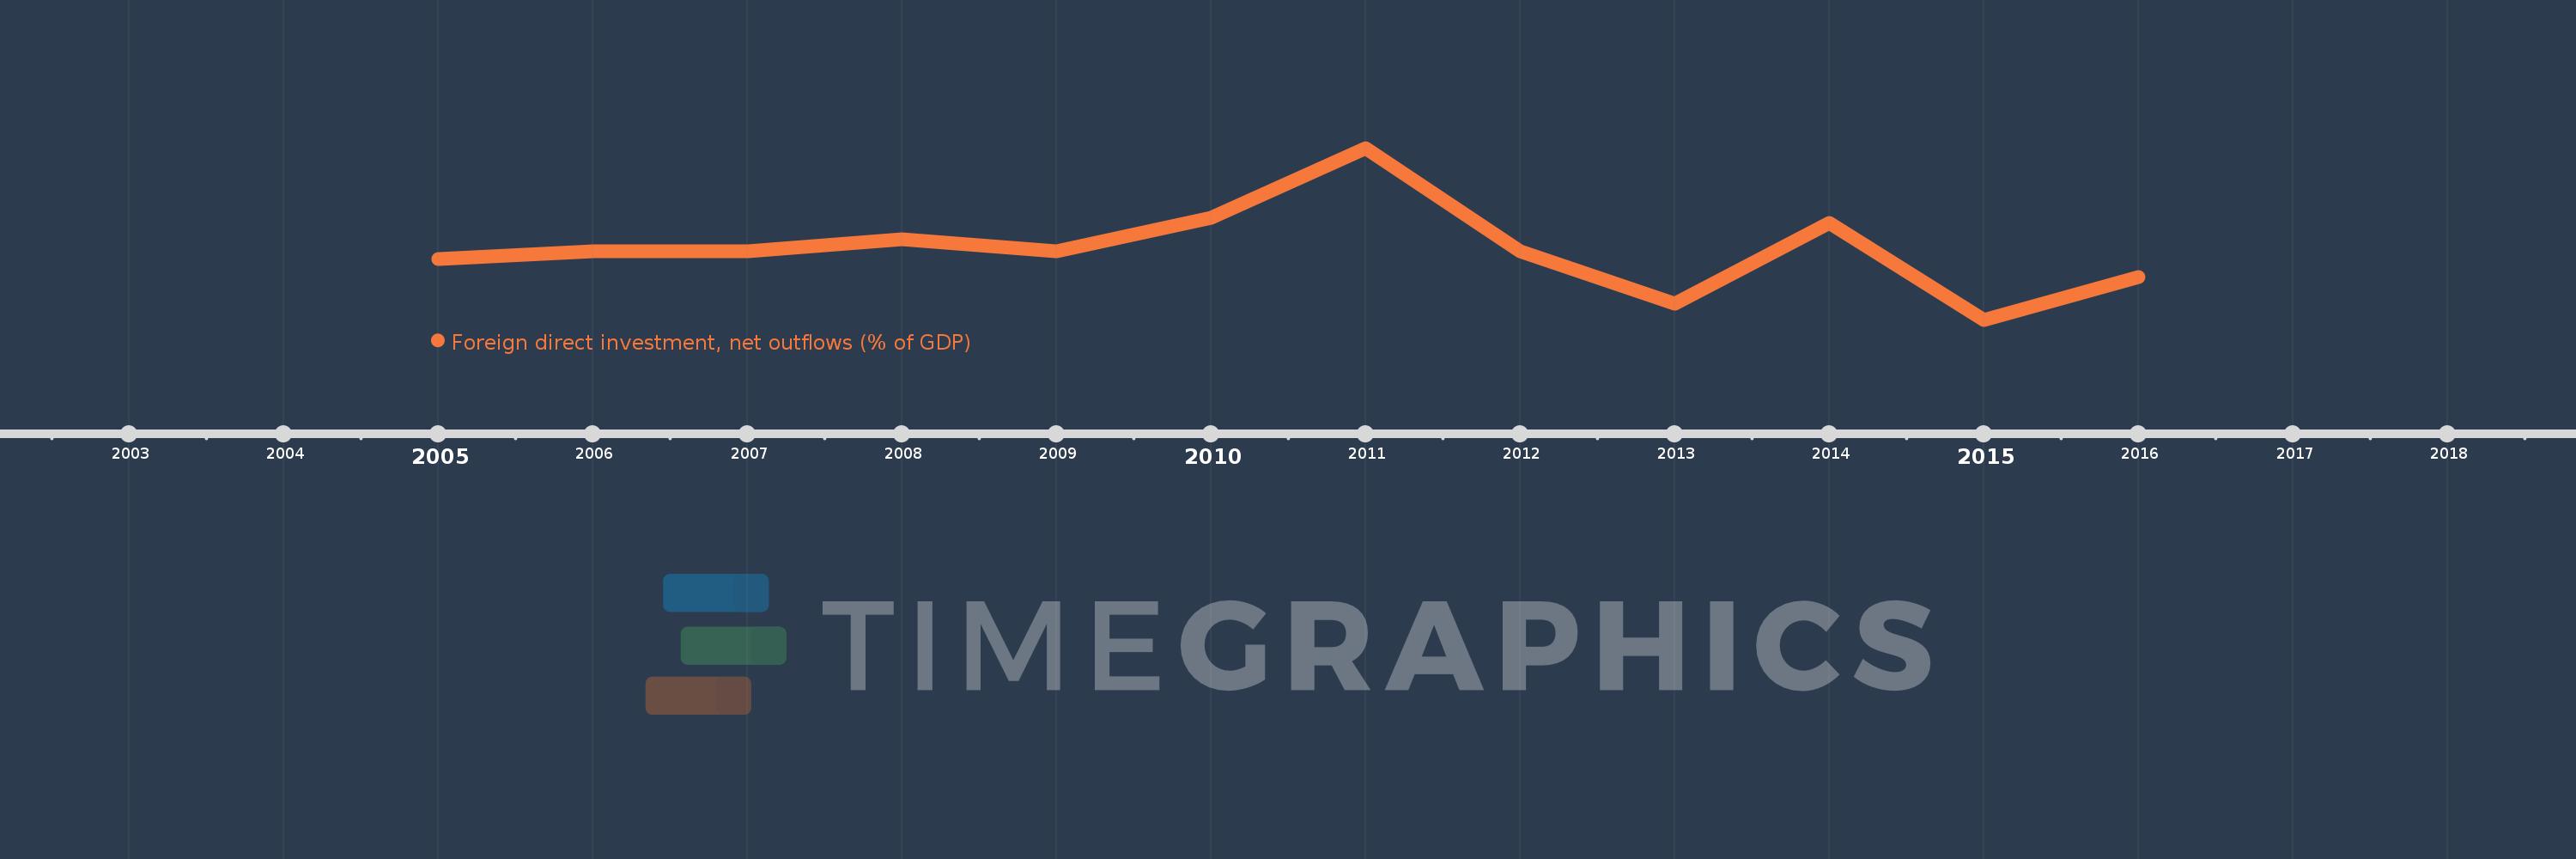
This timeline shows a graph from 2005 to 2016 of Zambia. No data until 2004. Number of actual observations by date: 12.
Source name:
World Development Indicators
Source organization:
International Monetary Fund, International Financial Statistics and Balance of Payments databases, World Bank, International Debt Statistics, and World Bank and OECD GDP estimates.
Categories, topics:
Economy & Growth, Financial Sector
Last updated:
apr 23, 2017
Indicators value changes by year
Meaning:
0.095
Minimum:
-3.595
jan 1, 2015
Maximum:
5.405
jan 1, 2011
At the date of observation
Value
Absolute change
Change from the previous value
jan 1, 2005
-0.402
-0.402
0.0%
jan 1, 2006
0.0
+0.402
-100.0%
jan 1, 2007
0.0
0.0
%
jan 1, 2008
0.609
+0.609
%
jan 1, 2009
0.0
-0.609
-100.0%
jan 1, 2010
1.759
+1.759
%
jan 1, 2011
5.405
+3.647
207.37%
jan 1, 2012
-0.006
-5.411
-100.11%
jan 1, 2013
-2.752
-2.746
46.02K%
jan 1, 2014
1.46
+4.212
-153.05%
jan 1, 2015
-3.595
-5.055
-346.21%
jan 1, 2016
-1.336
+2.258
-62.82%
Ranking of countries by current statistics by years