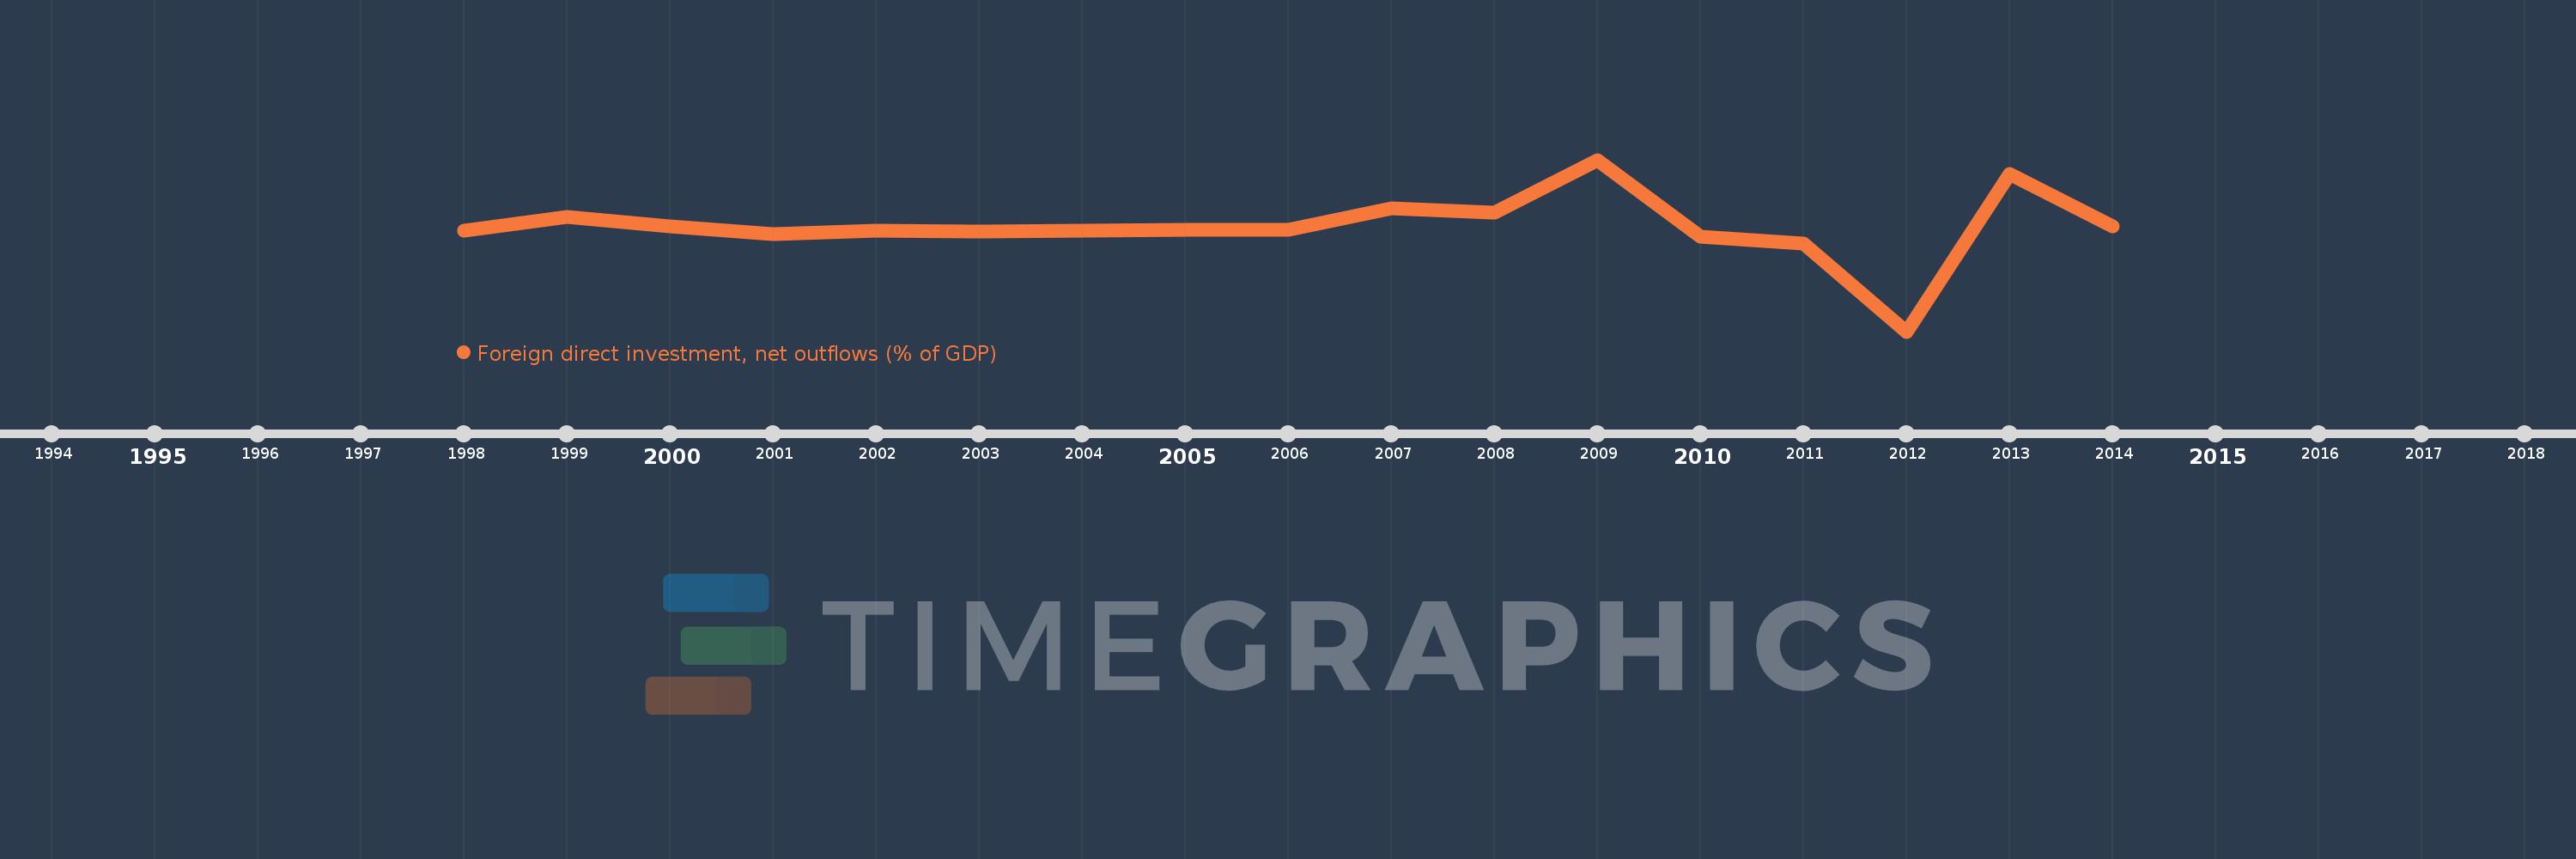
This timeline shows a graph from 1998 to 2014 of Bermuda. No data until 1997. Number of actual observations by date: 17.
Source name:
World Development Indicators
Source organization:
International Monetary Fund, International Financial Statistics and Balance of Payments databases, World Bank, International Debt Statistics, and World Bank and OECD GDP estimates.
Categories, topics:
Economy & Growth, Financial Sector
Last updated:
apr 23, 2017
Indicators value changes by year
Meaning:
0.87
Minimum:
-6.066
jan 1, 2012
Maximum:
5.285
jan 1, 2009
At the date of observation
Value
Absolute change
Change from the previous value
jan 1, 1998
0.614
+0.614
0.0%
jan 1, 1999
1.514
+0.9
146.69%
jan 1, 2000
0.863
-0.651
-42.98%
jan 1, 2001
0.399
-0.464
-53.74%
jan 1, 2002
0.619
+0.22
55.1%
jan 1, 2003
0.569
-0.051
-8.16%
jan 1, 2004
0.621
+0.052
9.16%
jan 1, 2005
0.685
+0.064
10.23%
jan 1, 2006
0.643
-0.042
-6.08%
jan 1, 2007
2.067
+1.424
221.44%
jan 1, 2008
1.779
-0.288
-13.94%
jan 1, 2009
5.285
+3.506
197.12%
jan 1, 2010
0.189
-5.096
-96.42%
jan 1, 2011
-0.242
-0.431
-228.01%
jan 1, 2012
-6.066
-5.824
2.41K%
jan 1, 2013
4.342
+10.408
-171.58%
jan 1, 2014
0.907
-3.434
-79.1%
Ranking of countries by current statistics by years