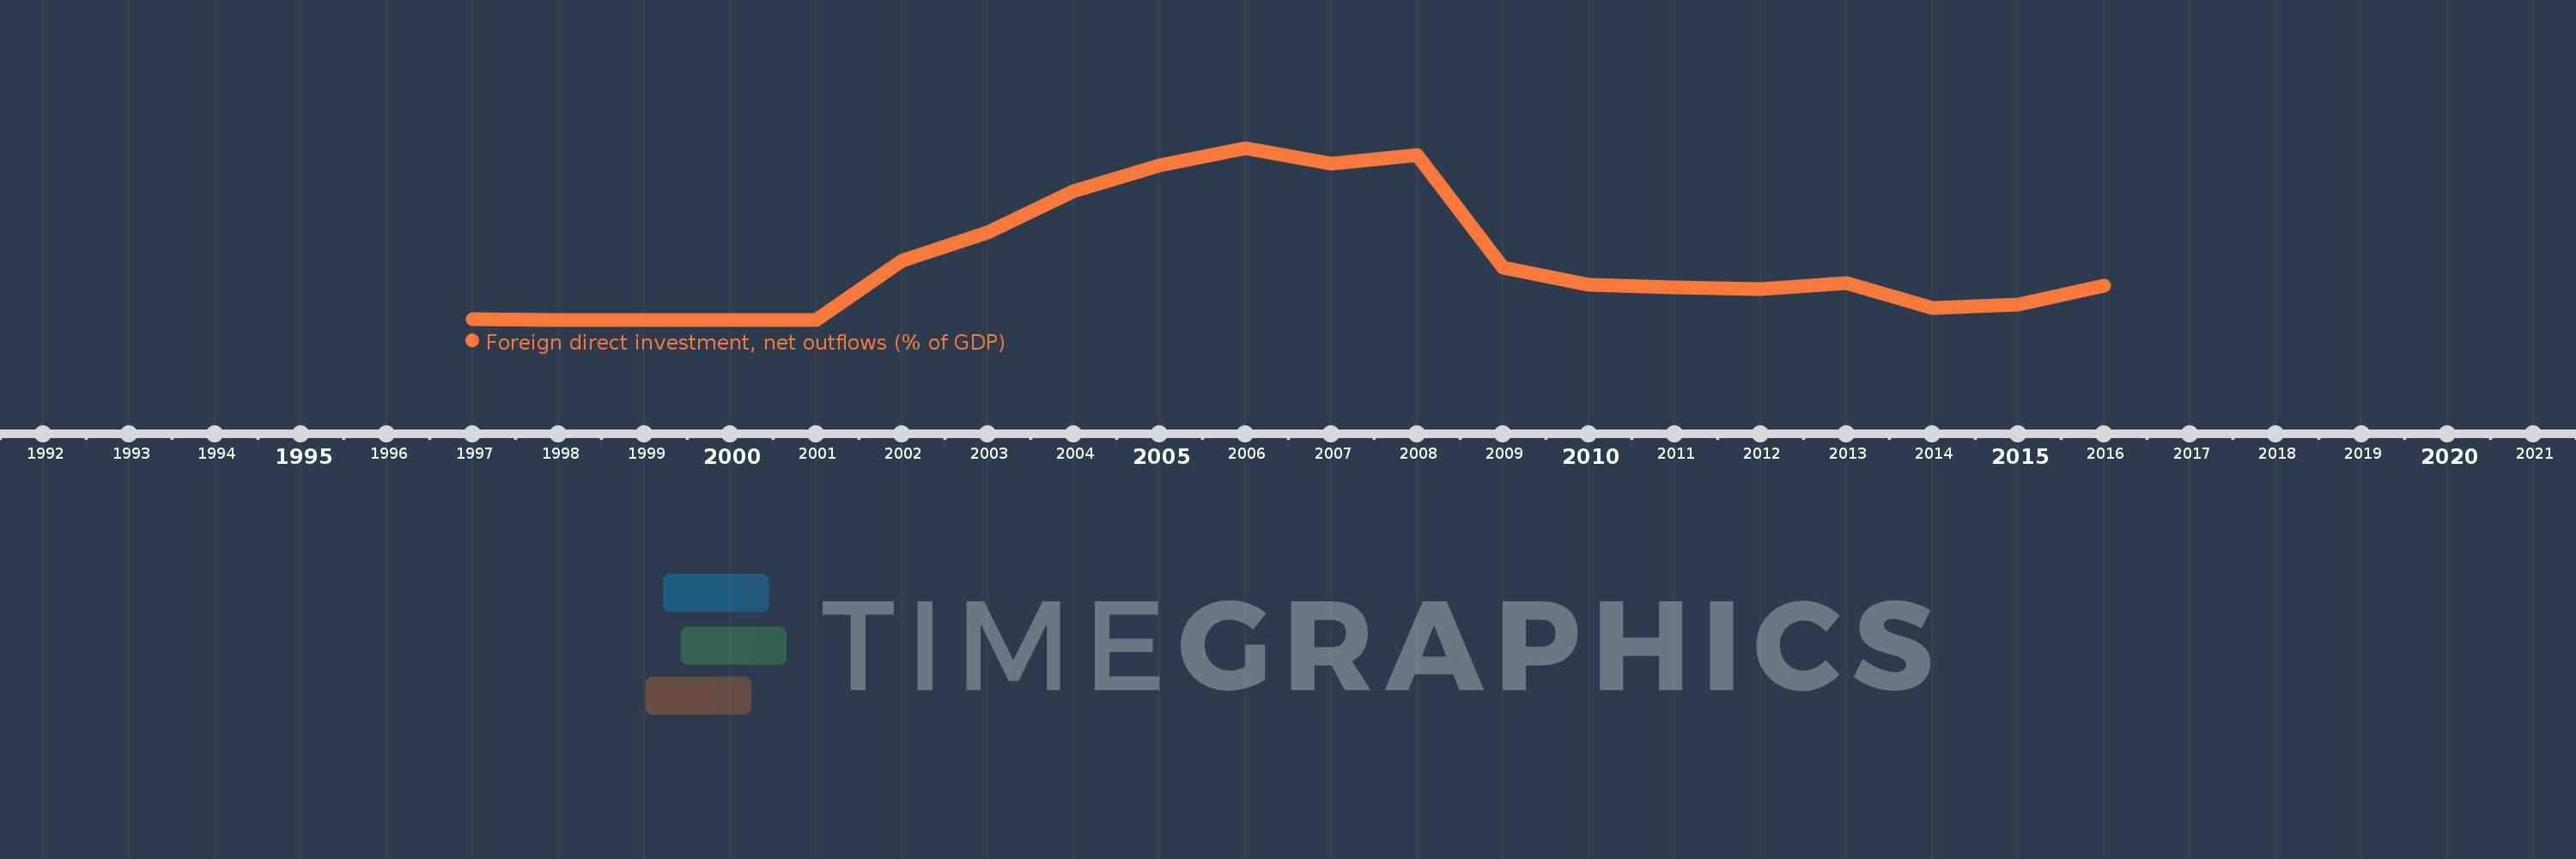
This timeline shows a graph from 1997 to 2016 of Azerbaijan. No data until 1996. Number of actual observations by date: 19.
Source name:
World Development Indicators
Source organization:
International Monetary Fund, International Financial Statistics and Balance of Payments databases, World Bank, International Debt Statistics, and World Bank and OECD GDP estimates.
Categories, topics:
Economy & Growth, Financial Sector
Last updated:
apr 23, 2017
Indicators value changes by year
Meaning:
10.879
Minimum:
0.0
jan 1, 1998
Maximum:
30.329
jan 1, 2006
At the date of observation
Value
Absolute change
Change from the previous value
jan 1, 1997
0.123
+0.123
0.0%
jan 1, 1998
0.0
-0.123
-99.92%
jan 1, 1999
0.0
+0.0
345.61%
jan 1, 2001
0.014
+0.014
3.1K%
jan 1, 2002
10.391
+10.376
71.99K%
jan 1, 2003
15.358
+4.968
47.81%
jan 1, 2004
22.755
+7.396
48.16%
jan 1, 2005
27.277
+4.523
19.88%
jan 1, 2006
30.329
+3.052
11.19%
jan 1, 2007
27.524
-2.805
-9.25%
jan 1, 2008
29.134
+1.609
5.85%
jan 1, 2009
9.268
-19.866
-68.19%
jan 1, 2010
6.215
-3.053
-32.94%
jan 1, 2011
5.712
-0.503
-8.1%
jan 1, 2012
5.387
-0.325
-5.7%
jan 1, 2013
6.519
+1.133
21.03%
jan 1, 2014
2.009
-4.51
-69.18%
jan 1, 2015
2.642
+0.633
31.53%
jan 1, 2016
6.05
+3.408
128.96%
Ranking of countries by current statistics by years