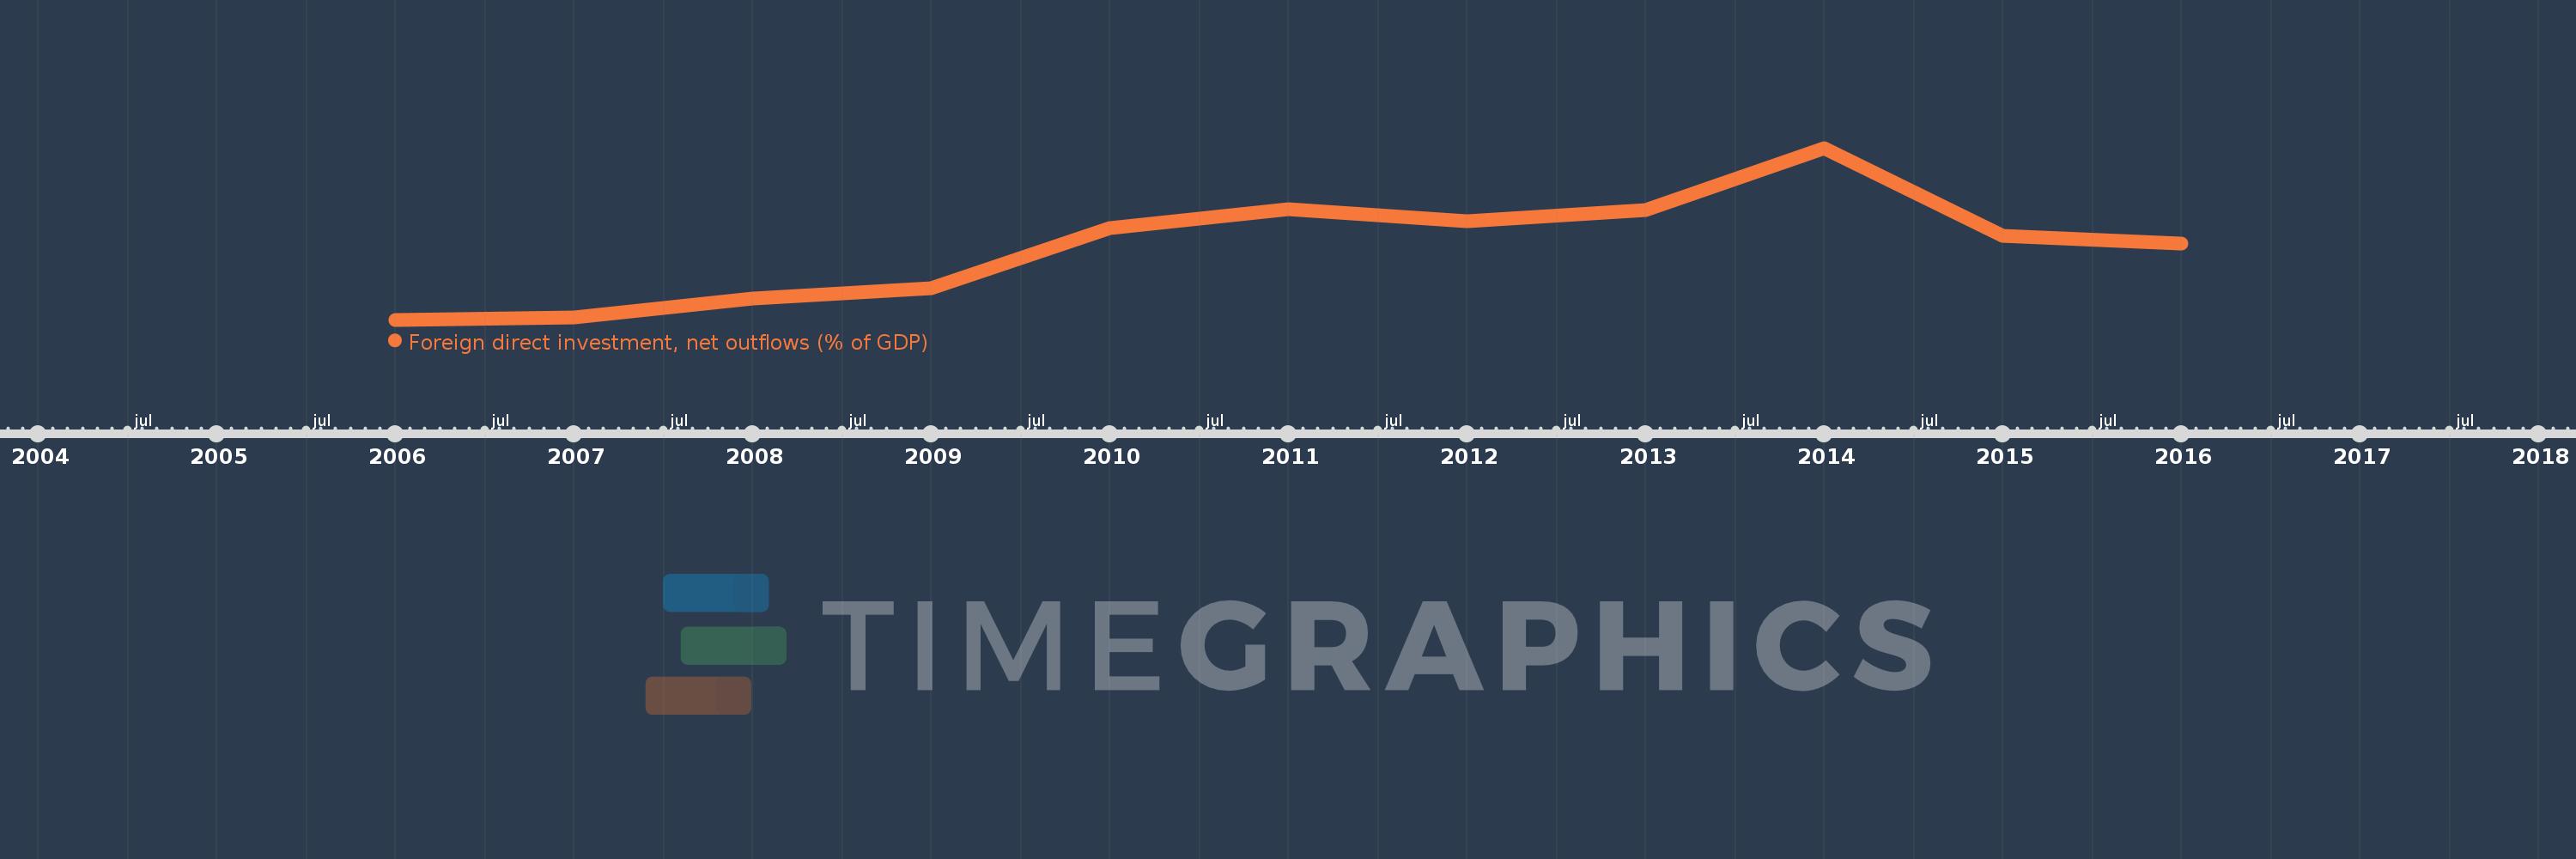
This timeline shows a graph from 2006 to 2016 of Vietnam. No data until 2005. Number of actual observations by date: 11.
Source name:
World Development Indicators
Source organization:
International Monetary Fund, International Financial Statistics and Balance of Payments databases, World Bank, International Debt Statistics, and World Bank and OECD GDP estimates.
Categories, topics:
Economy & Growth, Financial Sector
Last updated:
apr 23, 2017
Indicators value changes by year
Meaning:
0.547
Minimum:
0.113
jan 1, 2006
Maximum:
1.142
jan 1, 2014
At the date of observation
Value
Absolute change
Change from the previous value
jan 1, 2006
0.113
+0.113
0.0%
jan 1, 2007
0.128
+0.015
13.55%
jan 1, 2008
0.238
+0.11
85.59%
jan 1, 2009
0.303
+0.065
27.33%
jan 1, 2010
0.66
+0.358
118.18%
jan 1, 2011
0.776
+0.116
17.57%
jan 1, 2012
0.701
-0.075
-9.71%
jan 1, 2013
0.77
+0.069
9.88%
jan 1, 2014
1.142
+0.372
48.34%
jan 1, 2015
0.618
-0.525
-45.94%
jan 1, 2016
0.568
-0.049
-8.0%
Ranking of countries by current statistics by years