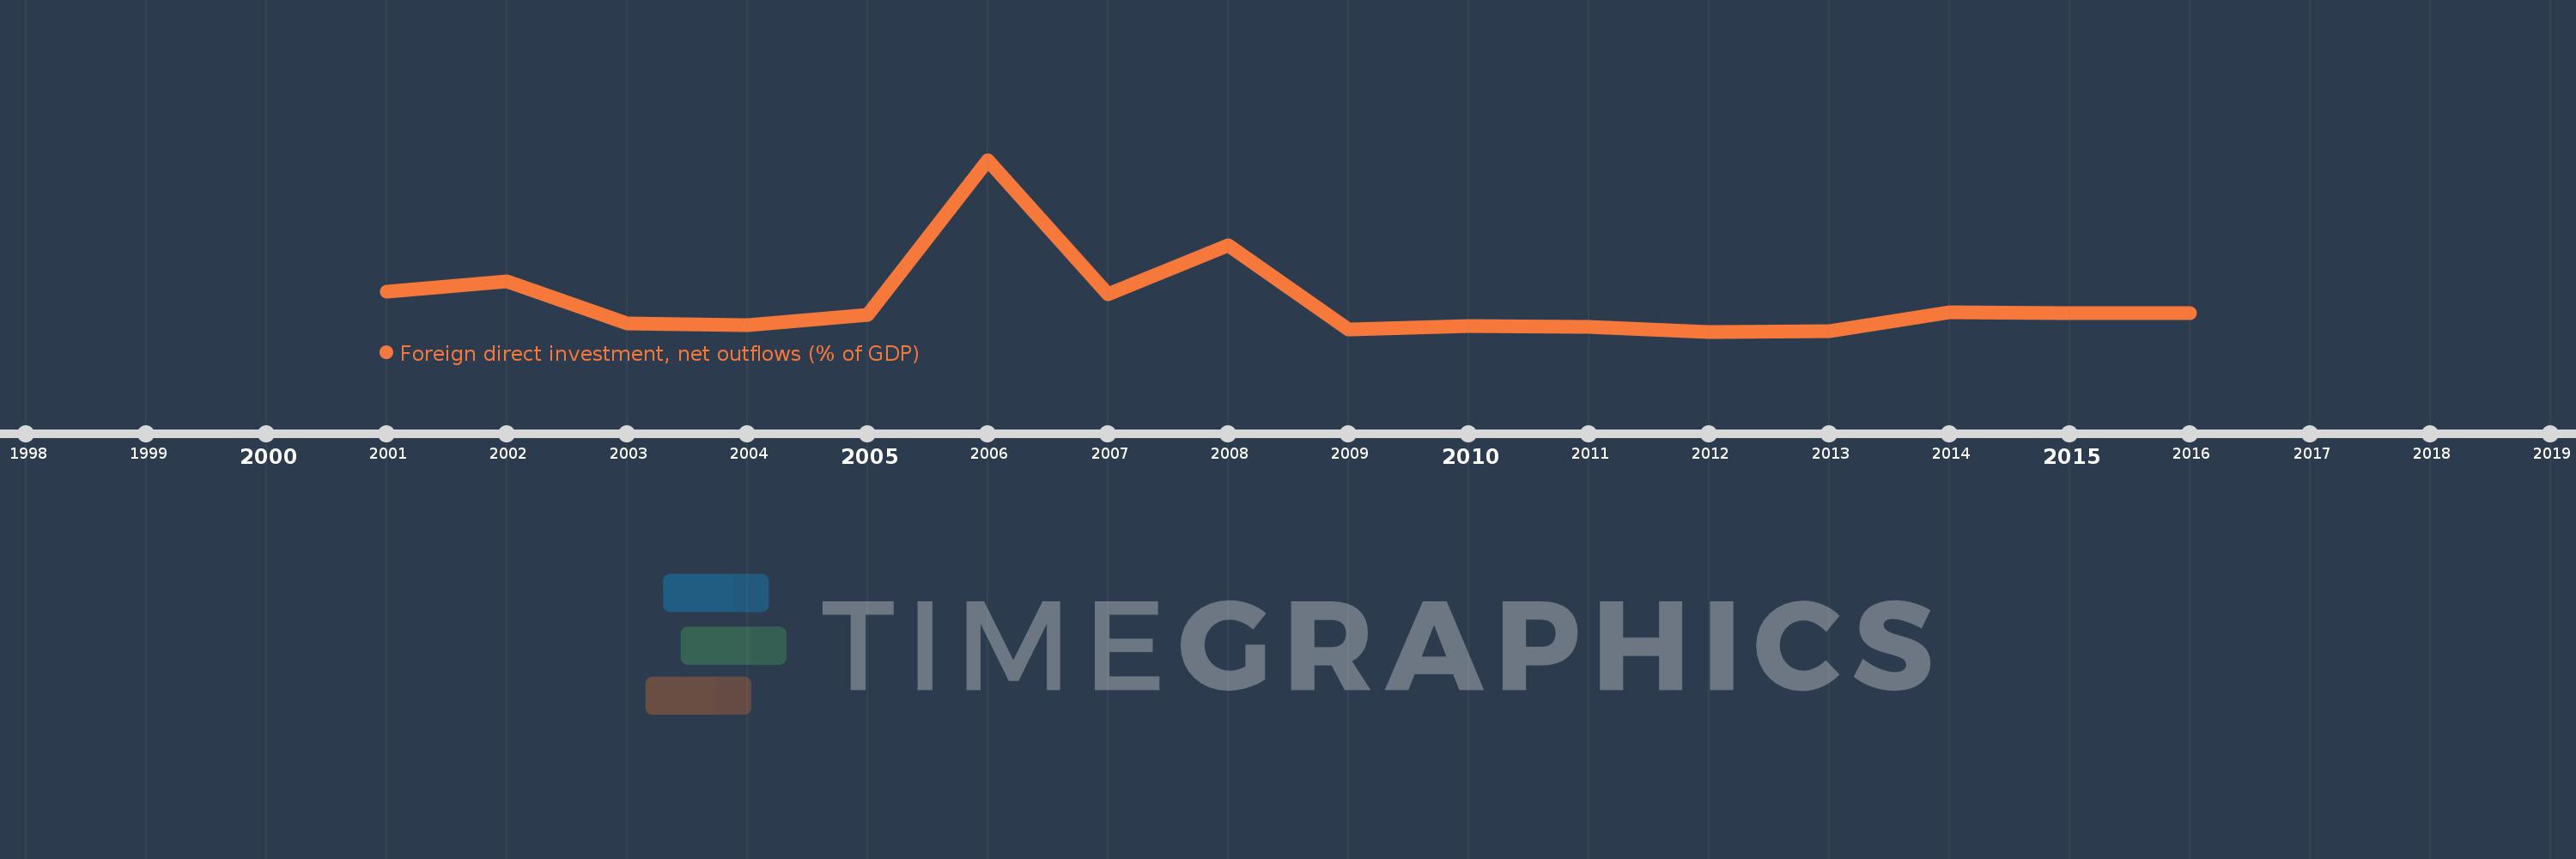
This timeline shows a graph from 2001 to 2016 of Dominica. No data until 2000. Number of actual observations by date: 16.
Source name:
World Development Indicators
Source organization:
International Monetary Fund, International Financial Statistics and Balance of Payments databases, World Bank, International Debt Statistics, and World Bank and OECD GDP estimates.
Categories, topics:
Economy & Growth, Financial Sector
Last updated:
apr 23, 2017
Indicators value changes by year
Meaning:
0.625
Minimum:
0.005
jan 1, 2012
Maximum:
3.503
jan 1, 2006
At the date of observation
Value
Absolute change
Change from the previous value
jan 1, 2001
0.819
+0.819
0.0%
jan 1, 2002
1.025
+0.206
25.11%
jan 1, 2003
0.172
-0.853
-83.19%
jan 1, 2004
0.135
-0.038
-21.84%
jan 1, 2005
0.343
+0.208
154.54%
jan 1, 2006
3.503
+3.16
921.94%
jan 1, 2007
0.768
-2.735
-78.07%
jan 1, 2008
1.763
+0.995
129.49%
jan 1, 2009
0.057
-1.705
-96.74%
jan 1, 2010
0.125
+0.068
117.54%
jan 1, 2011
0.106
-0.019
-15.25%
jan 1, 2012
0.005
-0.101
-95.12%
jan 1, 2013
0.007
+0.002
41.13%
jan 1, 2014
0.396
+0.388
5.32K%
jan 1, 2015
0.387
-0.009
-2.26%
jan 1, 2016
0.387
+0.001
0.14%
Ranking of countries by current statistics by years