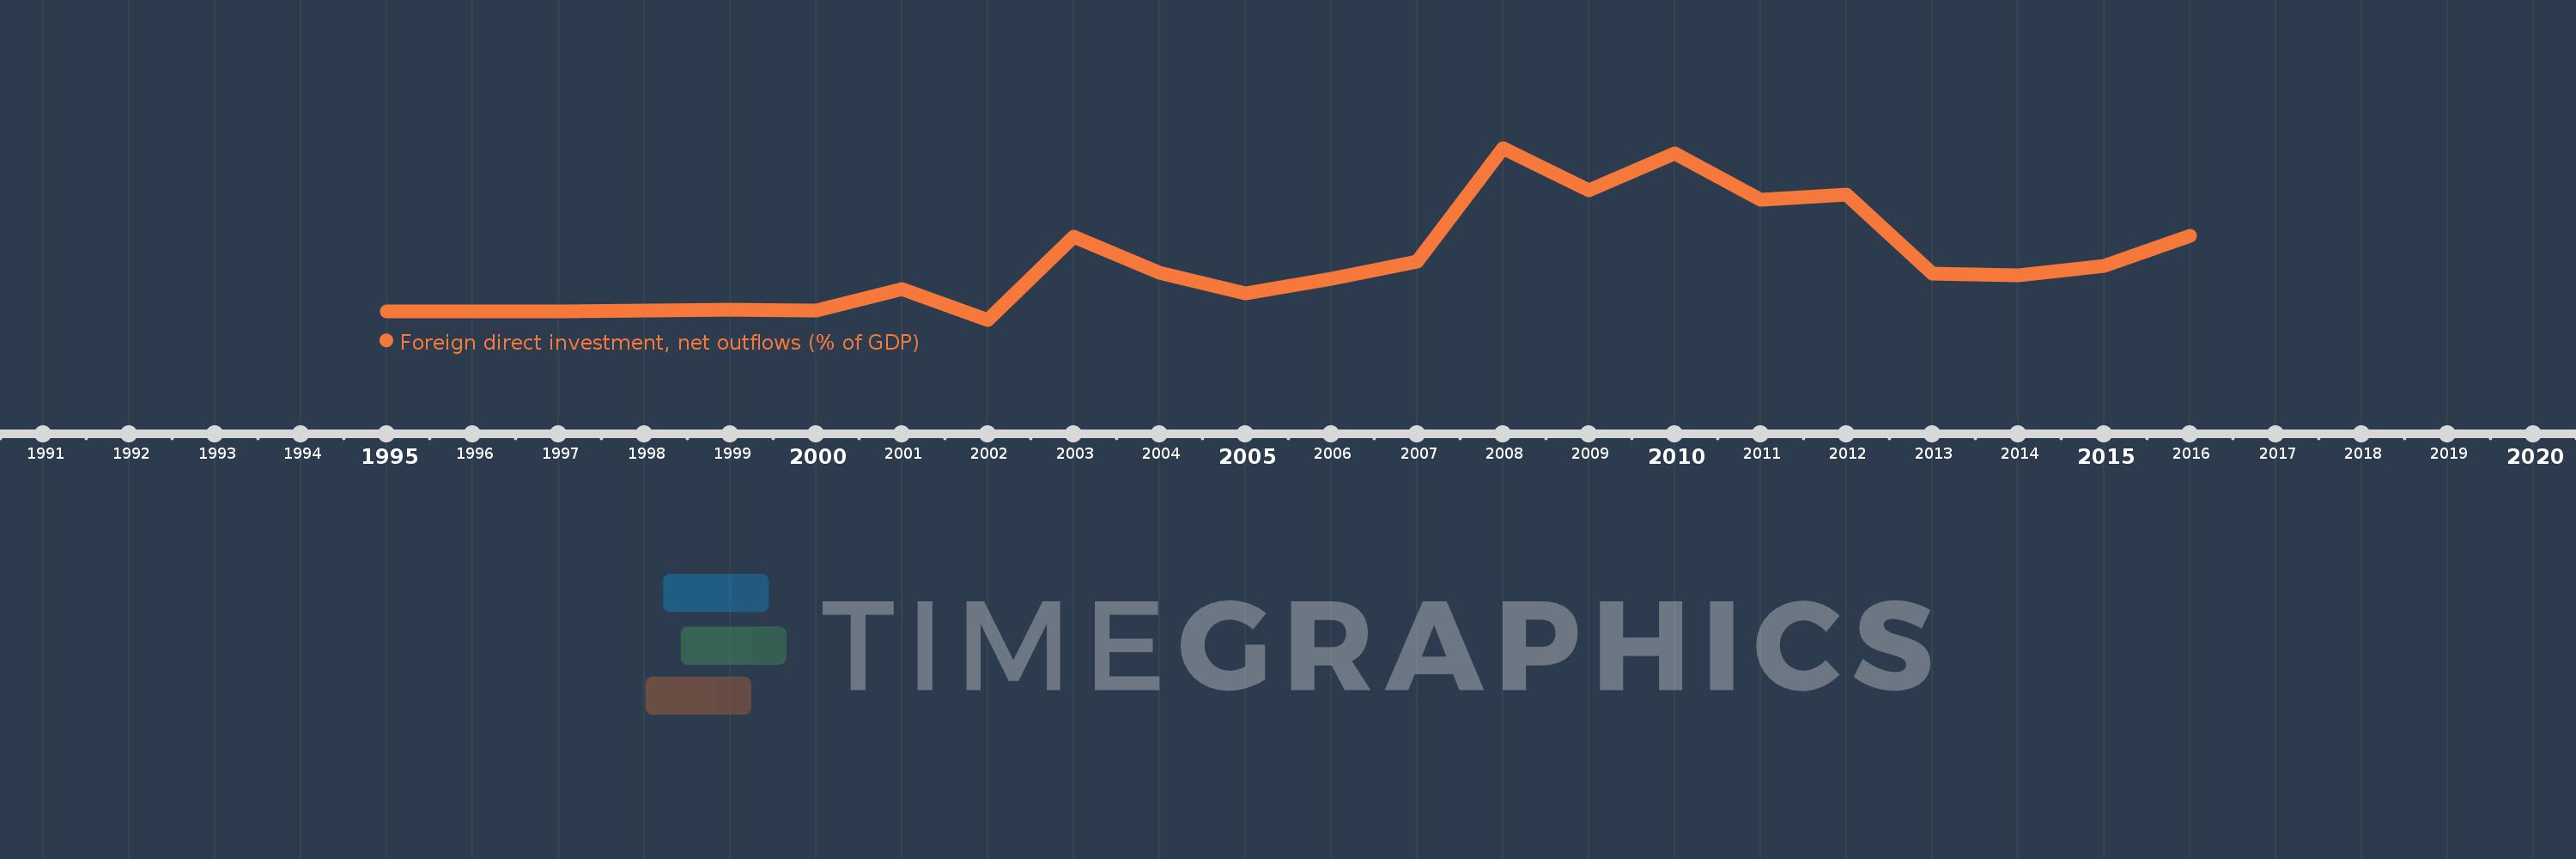
This timeline shows a graph from 1995 to 2016 of Kazakhstan. No data until 1994. Number of actual observations by date: 22.
Source name:
World Development Indicators
Source organization:
International Monetary Fund, International Financial Statistics and Balance of Payments databases, World Bank, International Debt Statistics, and World Bank and OECD GDP estimates.
Categories, topics:
Economy & Growth, Financial Sector
Last updated:
apr 23, 2017
Indicators value changes by year
Meaning:
1.144
Minimum:
-0.198
jan 1, 2002
Maximum:
3.76
jan 1, 2008
At the date of observation
Value
Absolute change
Change from the previous value
jan 1, 1995
0.0
+0.0
0.0%
jan 1, 1996
0.001
+0.001
682.27%
jan 1, 1997
0.0
-0.001
-99.68%
jan 1, 1998
0.006
+0.006
132.76K%
jan 1, 1999
0.037
+0.03
479.37%
jan 1, 2000
0.021
-0.015
-41.69%
jan 1, 2001
0.505
+0.484
2.27K%
jan 1, 2002
-0.198
-0.703
-139.15%
jan 1, 2003
1.724
+1.921
-972.08%
jan 1, 2004
0.875
-0.848
-49.22%
jan 1, 2005
0.415
-0.46
-52.58%
jan 1, 2006
0.747
+0.332
80.09%
jan 1, 2007
1.138
+0.39
52.24%
jan 1, 2008
3.76
+2.622
230.42%
jan 1, 2009
2.776
-0.984
-26.17%
jan 1, 2010
3.636
+0.86
30.99%
jan 1, 2011
2.561
-1.075
-29.58%
jan 1, 2012
2.688
+0.127
4.97%
jan 1, 2013
0.862
-1.826
-67.94%
jan 1, 2014
0.835
-0.026
-3.05%
jan 1, 2015
1.049
+0.214
25.61%
jan 1, 2016
1.732
+0.683
65.08%
Ranking of countries by current statistics by years