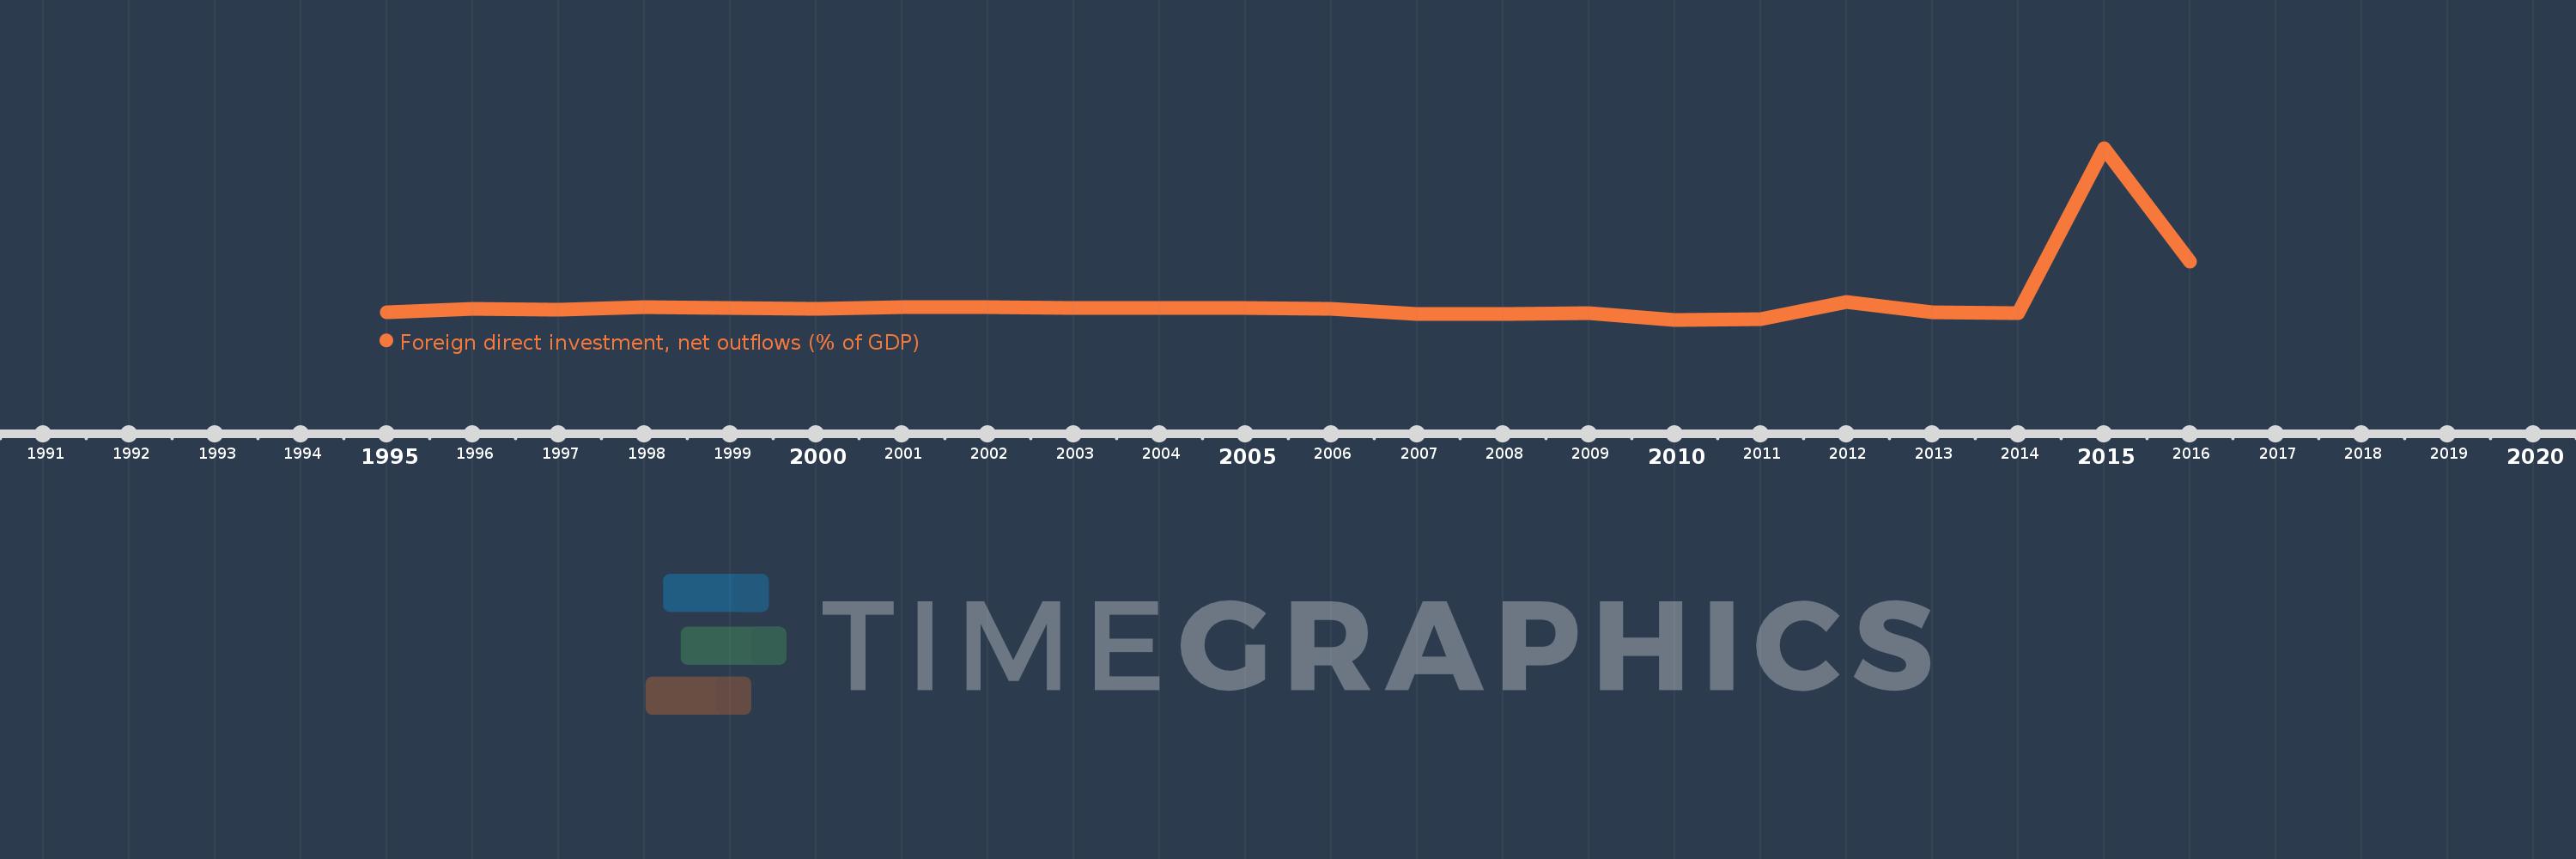
This timeline shows a graph from 1995 to 2016 of Kiribati. No data until 1994. Number of actual observations by date: 22.
Source name:
World Development Indicators
Source organization:
International Monetary Fund, International Financial Statistics and Balance of Payments databases, World Bank, International Debt Statistics, and World Bank and OECD GDP estimates.
Categories, topics:
Economy & Growth, Financial Sector
Last updated:
apr 23, 2017
Indicators value changes by year
Meaning:
0.335
Minimum:
-0.147
jan 1, 2010
Maximum:
4.23
jan 1, 2015
At the date of observation
Value
Absolute change
Change from the previous value
jan 1, 1995
0.051
+0.051
0.0%
jan 1, 1996
0.132
+0.081
159.68%
jan 1, 1997
0.118
-0.014
-10.58%
jan 1, 1998
0.165
+0.047
40.11%
jan 1, 1999
0.144
-0.021
-12.5%
jan 1, 2000
0.14
-0.004
-2.8%
jan 1, 2001
0.172
+0.032
22.98%
jan 1, 2002
0.164
-0.008
-4.92%
jan 1, 2003
0.151
-0.013
-8.19%
jan 1, 2004
0.144
-0.007
-4.49%
jan 1, 2005
0.144
0.0
-0.05%
jan 1, 2006
0.136
-0.007
-5.2%
jan 1, 2007
0.007
-0.129
-94.91%
jan 1, 2008
0.006
-0.001
-7.75%
jan 1, 2009
0.019
+0.013
201.26%
jan 1, 2010
-0.147
-0.166
-861.93%
jan 1, 2011
-0.14
+0.007
-5.02%
jan 1, 2012
0.316
+0.455
-326.3%
jan 1, 2013
0.043
-0.273
-86.45%
jan 1, 2014
0.032
-0.011
-25.05%
jan 1, 2015
4.23
+4.198
13.09K%
jan 1, 2016
1.341
-2.889
-68.29%
Ranking of countries by current statistics by years