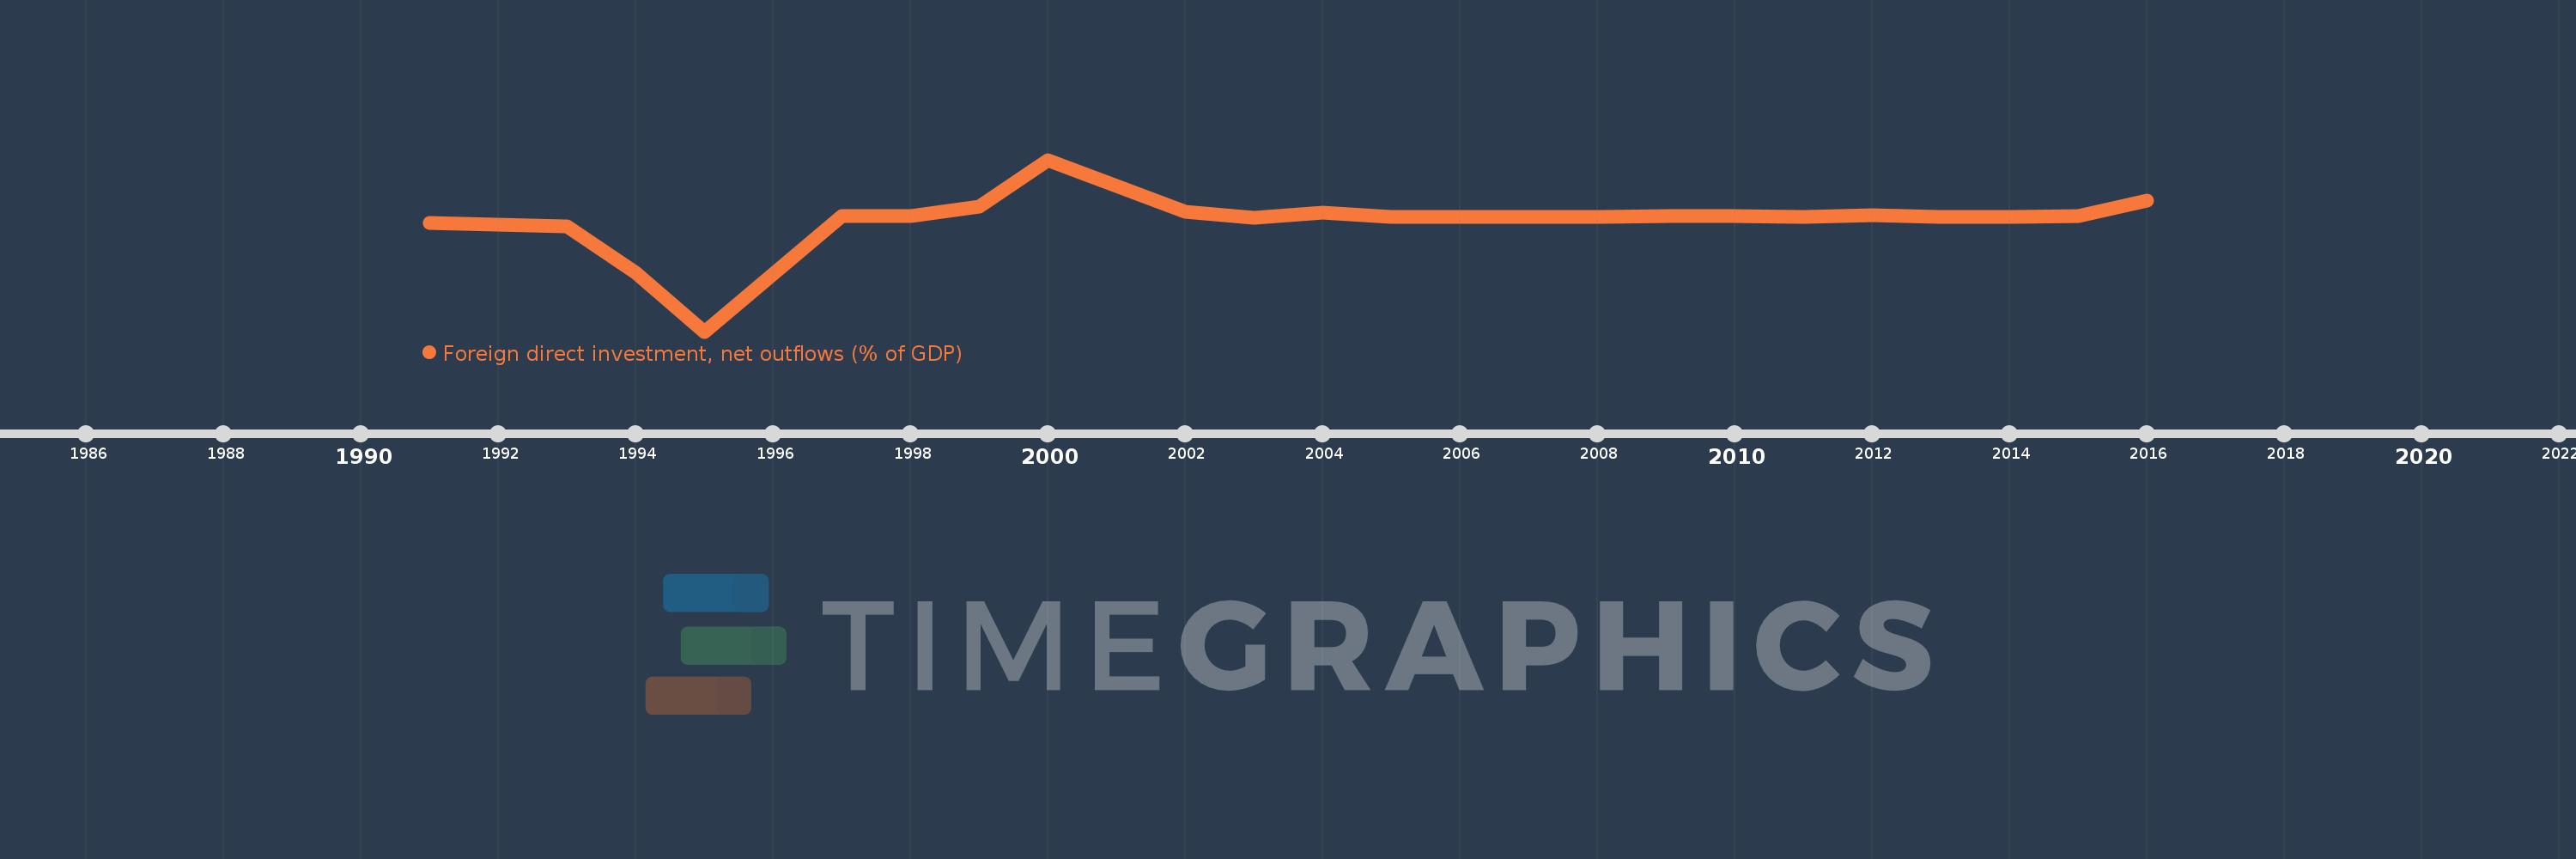
This timeline shows a graph from 1991 to 2016 of Ghana. No data until 1990. Number of actual observations by date: 24.
Source name:
World Development Indicators
Source organization:
International Monetary Fund, International Financial Statistics and Balance of Payments databases, World Bank, International Debt Statistics, and World Bank and OECD GDP estimates.
Categories, topics:
Economy & Growth, Financial Sector
Last updated:
apr 23, 2017
Indicators value changes by year
Meaning:
-0.157
Minimum:
-4.28
jan 1, 1995
Maximum:
2.115
jan 1, 2000
At the date of observation
Value
Absolute change
Change from the previous value
jan 1, 1991
-0.251
-0.251
0.0%
jan 1, 1992
-0.303
-0.052
20.64%
jan 1, 1993
-0.351
-0.048
15.7%
jan 1, 1994
-2.095
-1.744
497.24%
jan 1, 1995
-4.28
-2.184
104.26%
jan 1, 1997
0.019
+4.298
-100.44%
jan 1, 1998
0.024
+0.006
30.35%
jan 1, 1999
0.357
+0.332
1.36K%
jan 1, 2000
2.115
+1.759
493.27%
jan 1, 2002
0.18
-1.936
-91.5%
jan 1, 2003
-0.033
-0.213
-118.43%
jan 1, 2004
0.141
+0.174
-525.2%
jan 1, 2005
-0.011
-0.152
-107.82%
jan 1, 2006
0.0
+0.011
-100.0%
jan 1, 2007
0.0
0.0
%
jan 1, 2008
0.0
0.0
%
jan 1, 2009
0.028
+0.028
%
jan 1, 2010
0.027
-0.001
-4.81%
jan 1, 2011
0.0
-0.027
-100.0%
jan 1, 2012
0.064
+0.064
%
jan 1, 2013
0.003
-0.061
-95.94%
jan 1, 2014
0.001
-0.001
-46.07%
jan 1, 2015
0.017
+0.015
1.08K%
jan 1, 2016
0.59
+0.573
3.46K%
Ranking of countries by current statistics by years