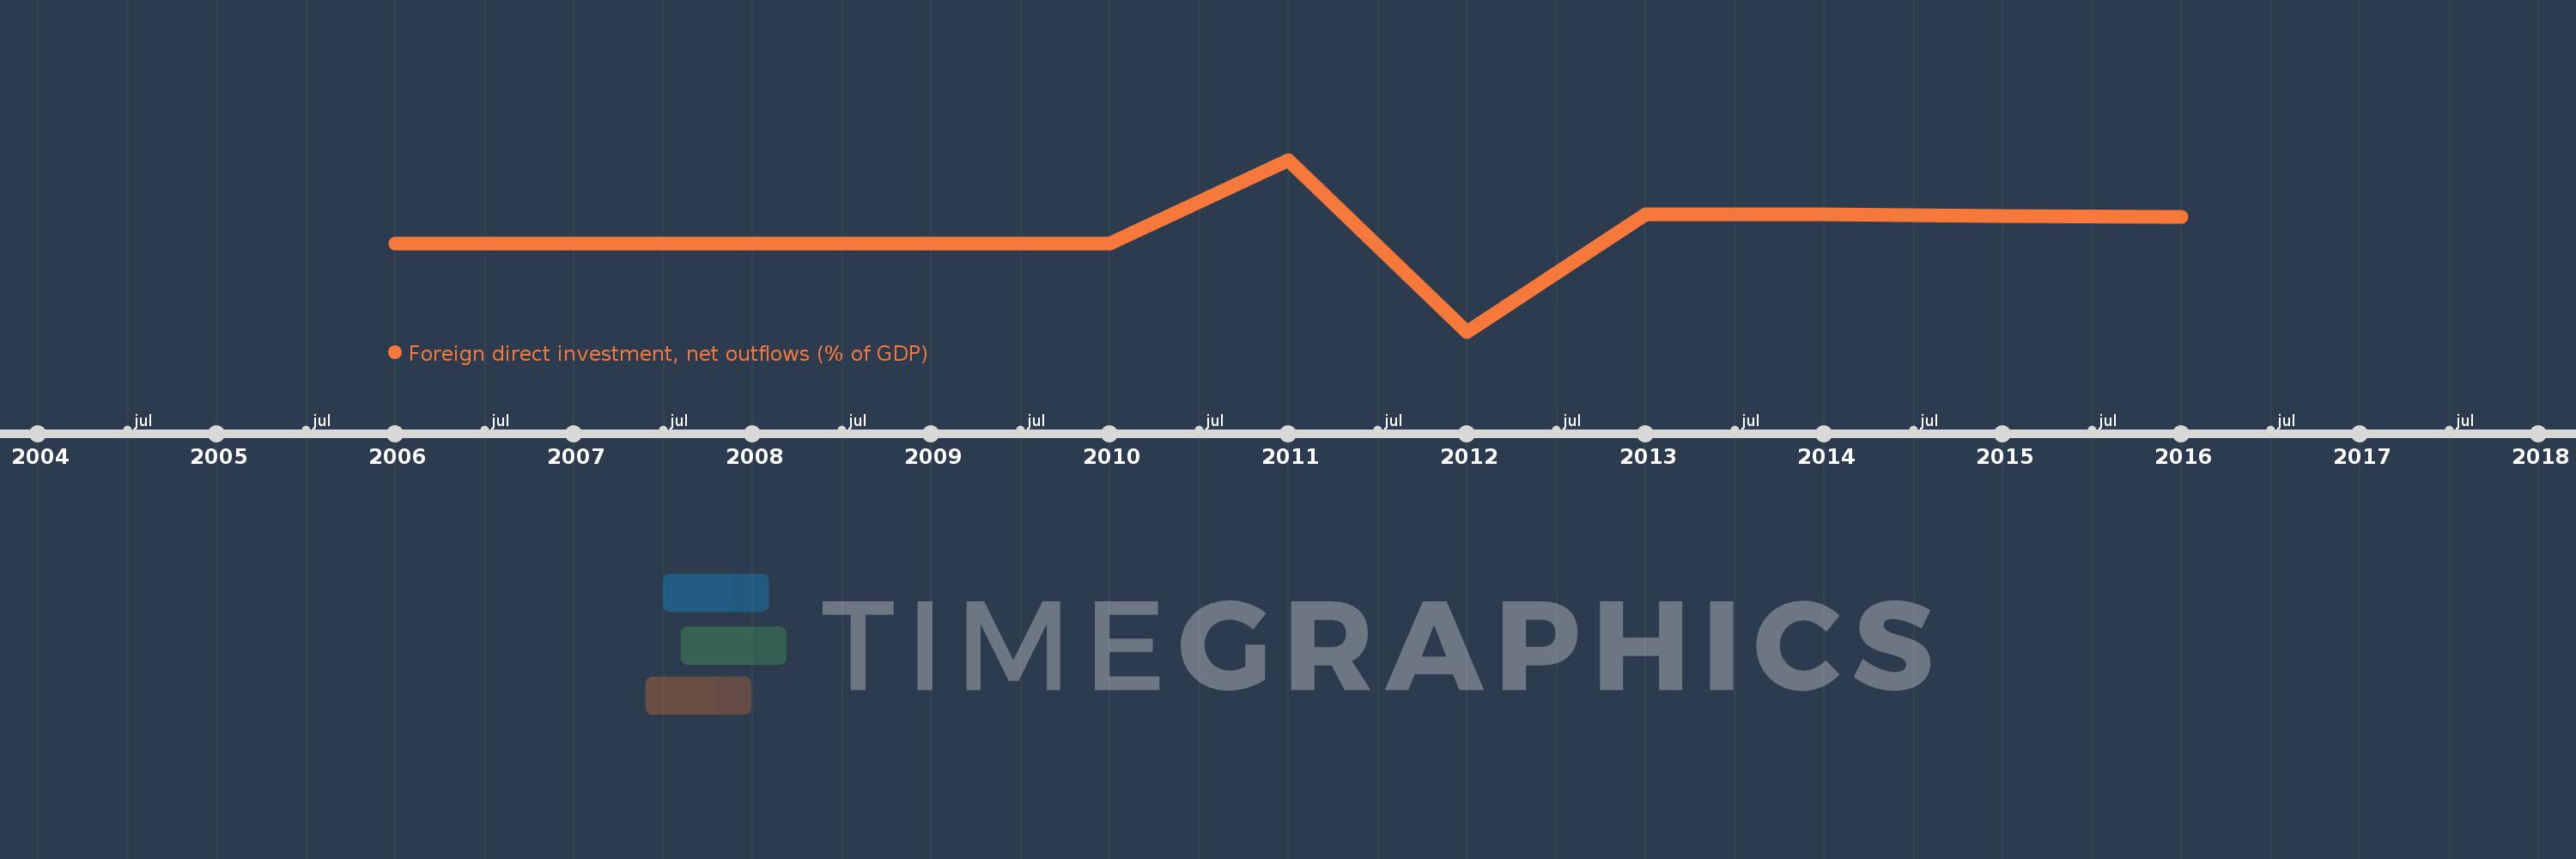
This timeline shows a graph from 2006 to 2016 of Timor-Leste. No data until 2005. Number of actual observations by date: 11.
Source name:
World Development Indicators
Source organization:
International Monetary Fund, International Financial Statistics and Balance of Payments databases, World Bank, International Debt Statistics, and World Bank and OECD GDP estimates.
Categories, topics:
Economy & Growth, Financial Sector
Last updated:
apr 23, 2017
Indicators value changes by year
Meaning:
0.328
Minimum:
-2.875
jan 1, 2012
Maximum:
2.757
jan 1, 2011
At the date of observation
Value
Absolute change
Change from the previous value
jan 1, 2006
0.0
0.0
0.0%
jan 1, 2007
0.0
0.0
%
jan 1, 2008
0.0
0.0
%
jan 1, 2009
0.0
0.0
%
jan 1, 2010
0.0
0.0
%
jan 1, 2011
2.757
+2.757
%
jan 1, 2012
-2.875
-5.632
-204.26%
jan 1, 2013
0.98
+3.854
-134.08%
jan 1, 2014
0.965
-0.014
-1.45%
jan 1, 2015
0.905
-0.06
-6.22%
jan 1, 2016
0.879
-0.027
-2.96%
Ranking of countries by current statistics by years