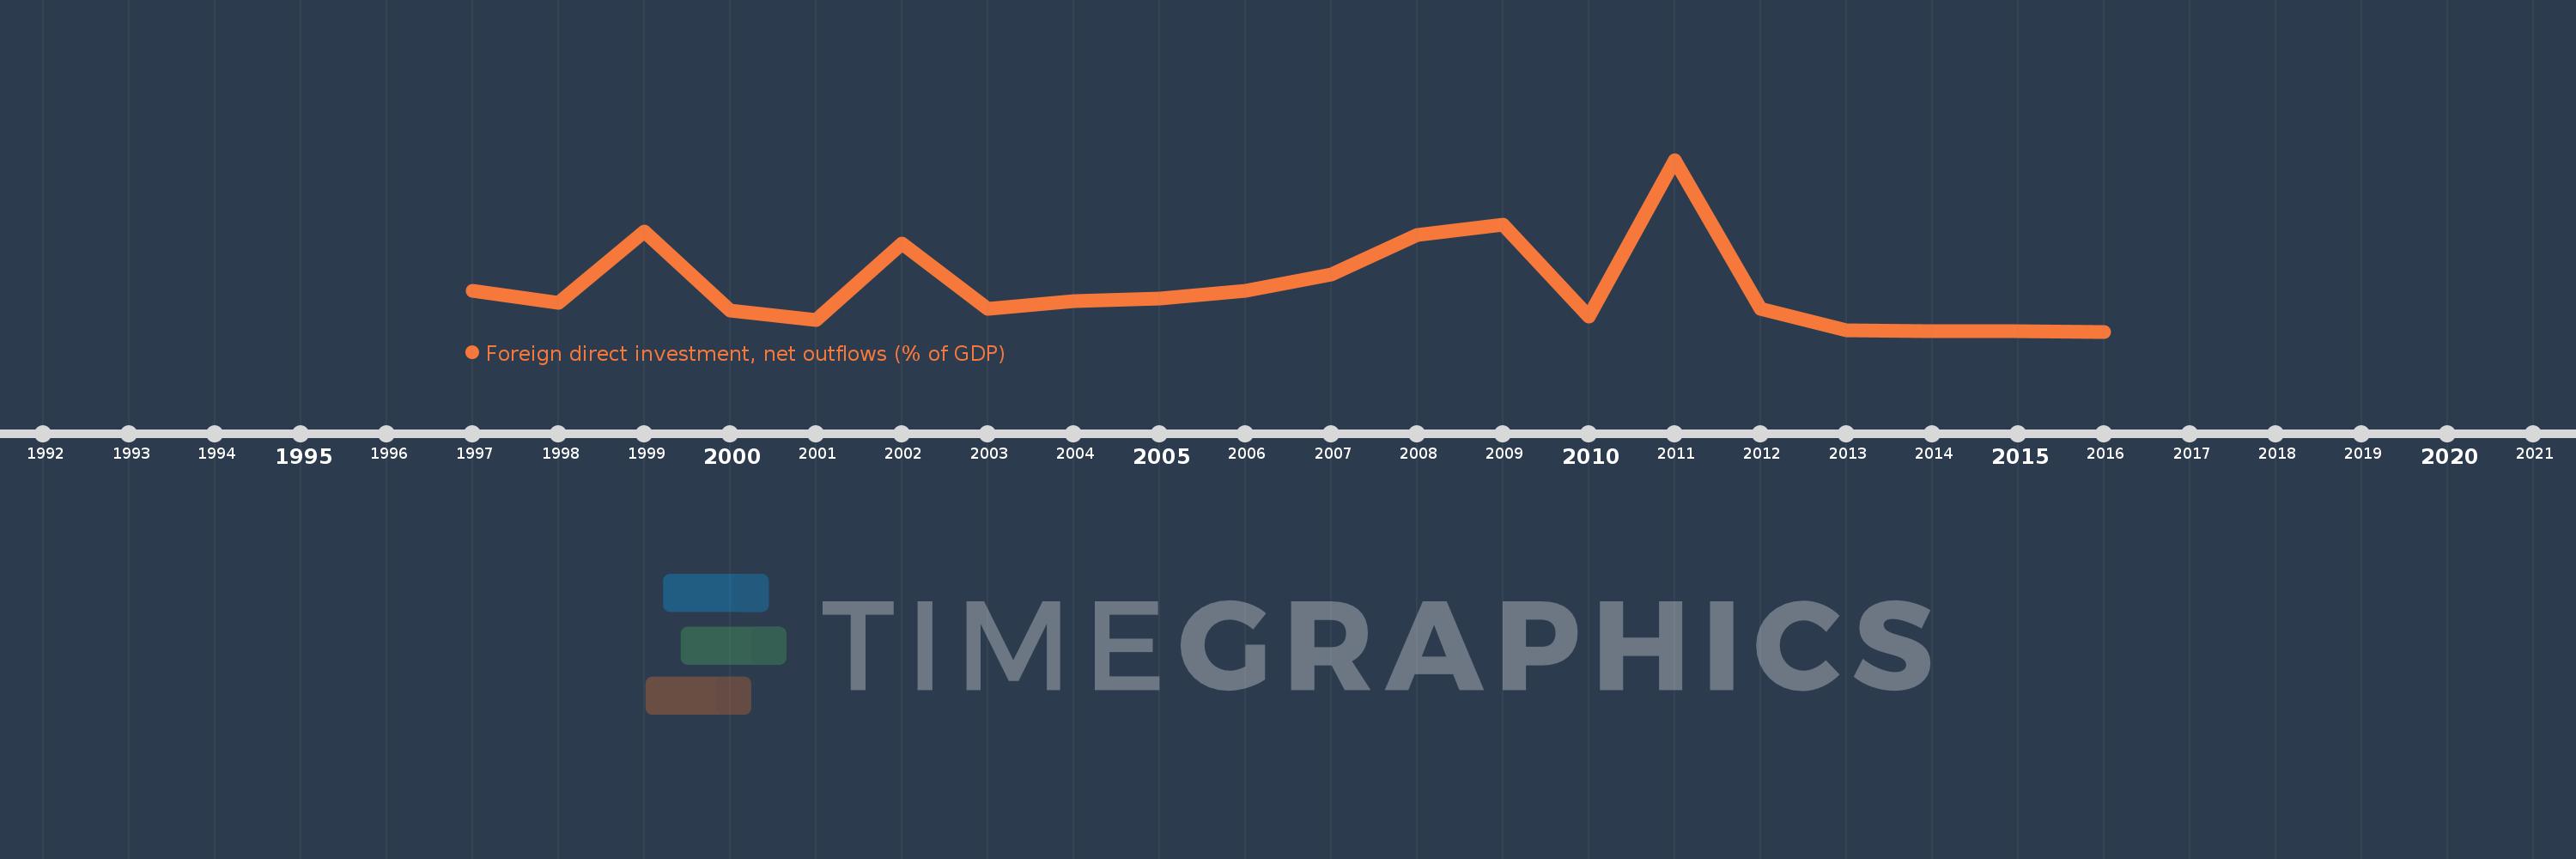
This timeline shows a graph from 1997 to 2016 of Malawi. No data until 1996. Number of actual observations by date: 20.
Source name:
World Development Indicators
Source organization:
International Monetary Fund, International Financial Statistics and Balance of Payments databases, World Bank, International Debt Statistics, and World Bank and OECD GDP estimates.
Categories, topics:
Economy & Growth, Financial Sector
Last updated:
apr 23, 2017
Indicators value changes by year
Meaning:
0.098
Minimum:
-0.08
jan 1, 2016
Maximum:
0.608
jan 1, 2011
At the date of observation
Value
Absolute change
Change from the previous value
jan 1, 1997
0.083
+0.083
0.0%
jan 1, 1998
0.034
-0.05
-59.43%
jan 1, 1999
0.32
+0.286
846.57%
jan 1, 2000
0.006
-0.314
-98.24%
jan 1, 2001
-0.034
-0.04
-711.16%
jan 1, 2002
0.274
+0.308
-895.66%
jan 1, 2003
0.01
-0.264
-96.36%
jan 1, 2004
0.041
+0.031
310.32%
jan 1, 2005
0.053
+0.012
28.99%
jan 1, 2006
0.083
+0.03
56.75%
jan 1, 2007
0.148
+0.065
78.99%
jan 1, 2008
0.308
+0.16
108.28%
jan 1, 2009
0.349
+0.041
13.23%
jan 1, 2010
-0.021
-0.37
-106.16%
jan 1, 2011
0.608
+0.629
-2.93K%
jan 1, 2012
0.012
-0.596
-98.05%
jan 1, 2013
-0.076
-0.088
-741.55%
jan 1, 2014
-0.077
-0.001
1.8%
jan 1, 2015
-0.078
-0.001
1.16%
jan 1, 2016
-0.08
-0.001
1.76%
Ranking of countries by current statistics by years