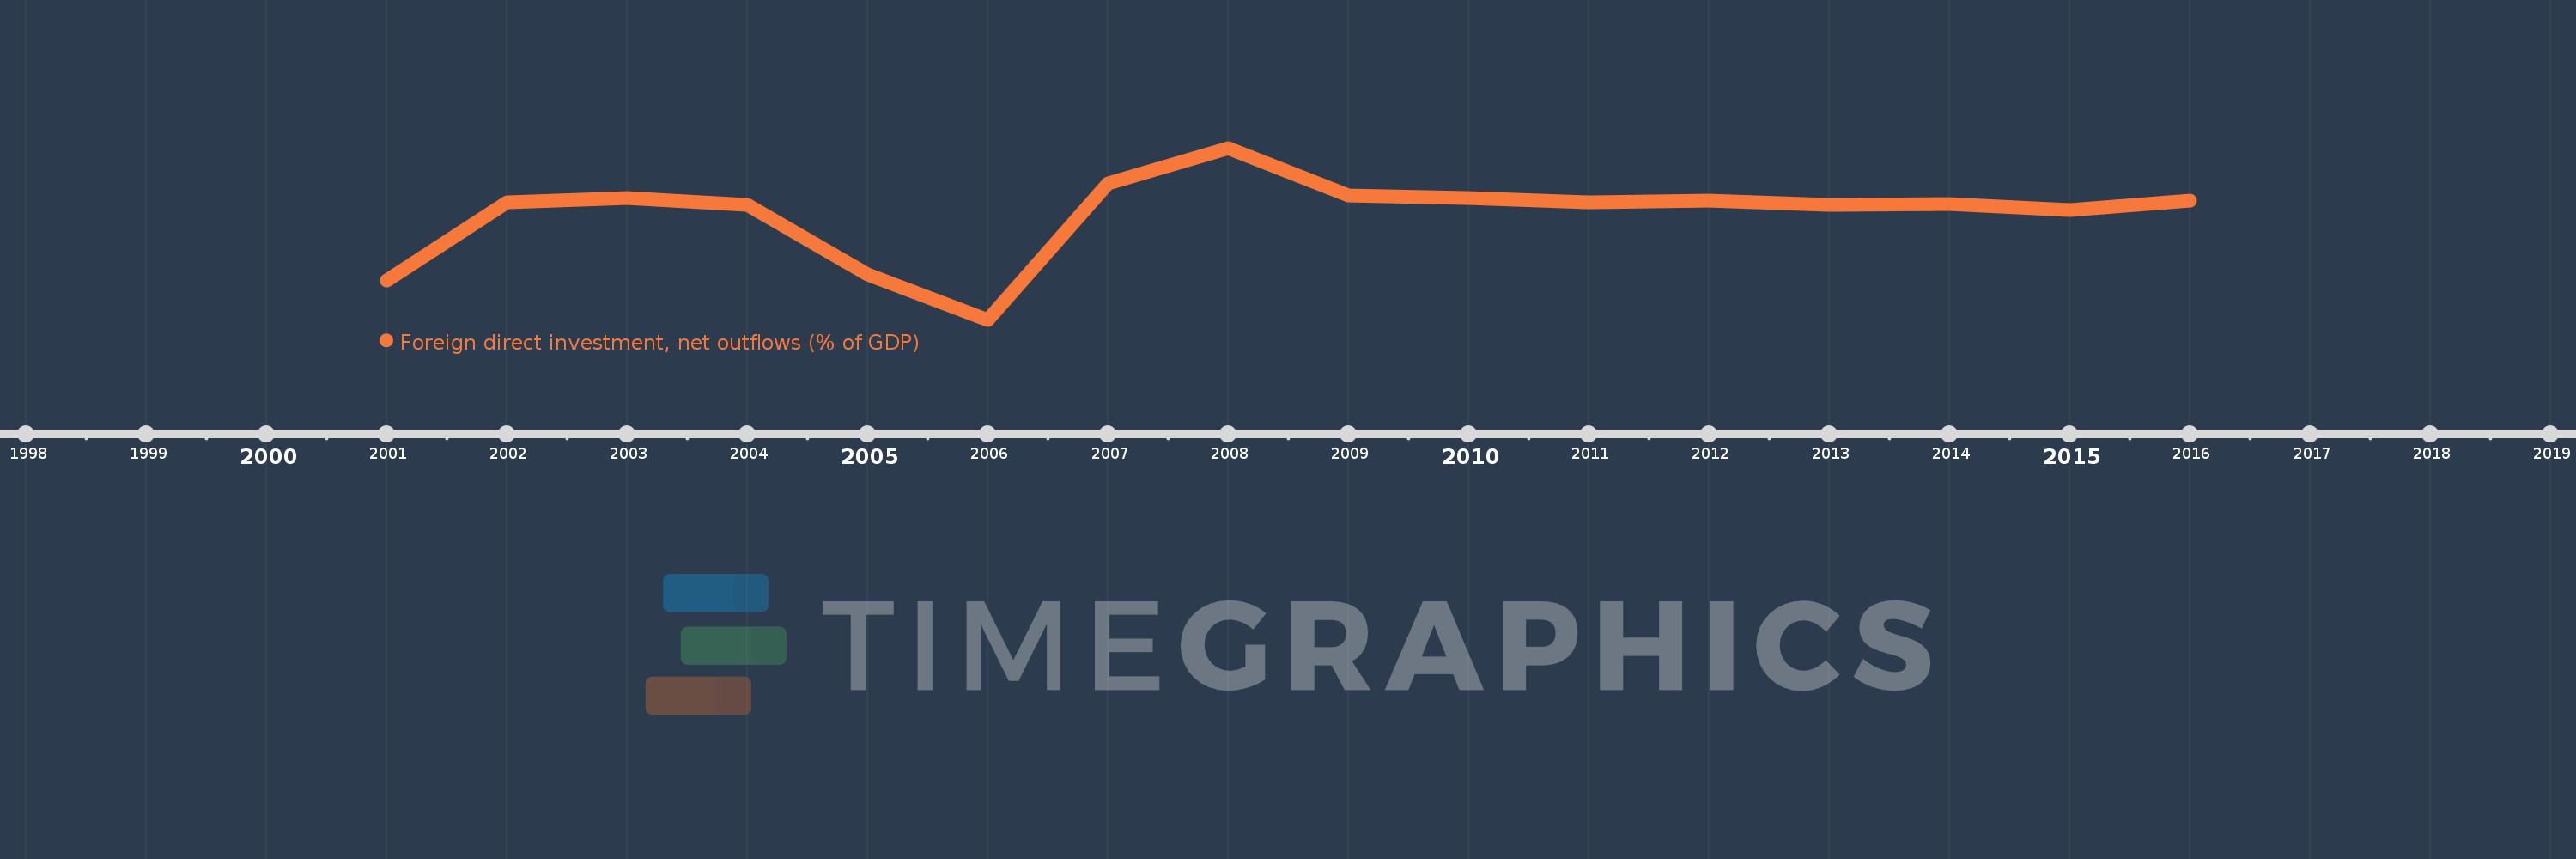
This timeline shows a graph from 2001 to 2016 of Solomon Islands. No data until 2000. Number of actual observations by date: 16.
Source name:
World Development Indicators
Source organization:
International Monetary Fund, International Financial Statistics and Balance of Payments databases, World Bank, International Debt Statistics, and World Bank and OECD GDP estimates.
Categories, topics:
Economy & Growth, Financial Sector
Last updated:
apr 23, 2017
Indicators value changes by year
Meaning:
-0.089
Minimum:
-3.976
jan 1, 2006
Maximum:
2.361
jan 1, 2008
At the date of observation
Value
Absolute change
Change from the previous value
jan 1, 2001
-2.52
-2.52
0.0%
jan 1, 2002
0.356
+2.876
-114.12%
jan 1, 2003
0.502
+0.146
40.9%
jan 1, 2004
0.246
-0.256
-50.95%
jan 1, 2005
-2.312
-2.558
-1.04K%
jan 1, 2006
-3.976
-1.664
71.98%
jan 1, 2007
1.038
+5.014
-126.12%
jan 1, 2008
2.361
+1.323
127.39%
jan 1, 2009
0.621
-1.741
-73.72%
jan 1, 2010
0.499
-0.121
-19.56%
jan 1, 2011
0.341
-0.158
-31.64%
jan 1, 2012
0.416
+0.075
22.06%
jan 1, 2013
0.248
-0.169
-40.48%
jan 1, 2014
0.286
+0.038
15.22%
jan 1, 2015
0.058
-0.227
-79.63%
jan 1, 2016
0.417
+0.359
617.33%
Ranking of countries by current statistics by years