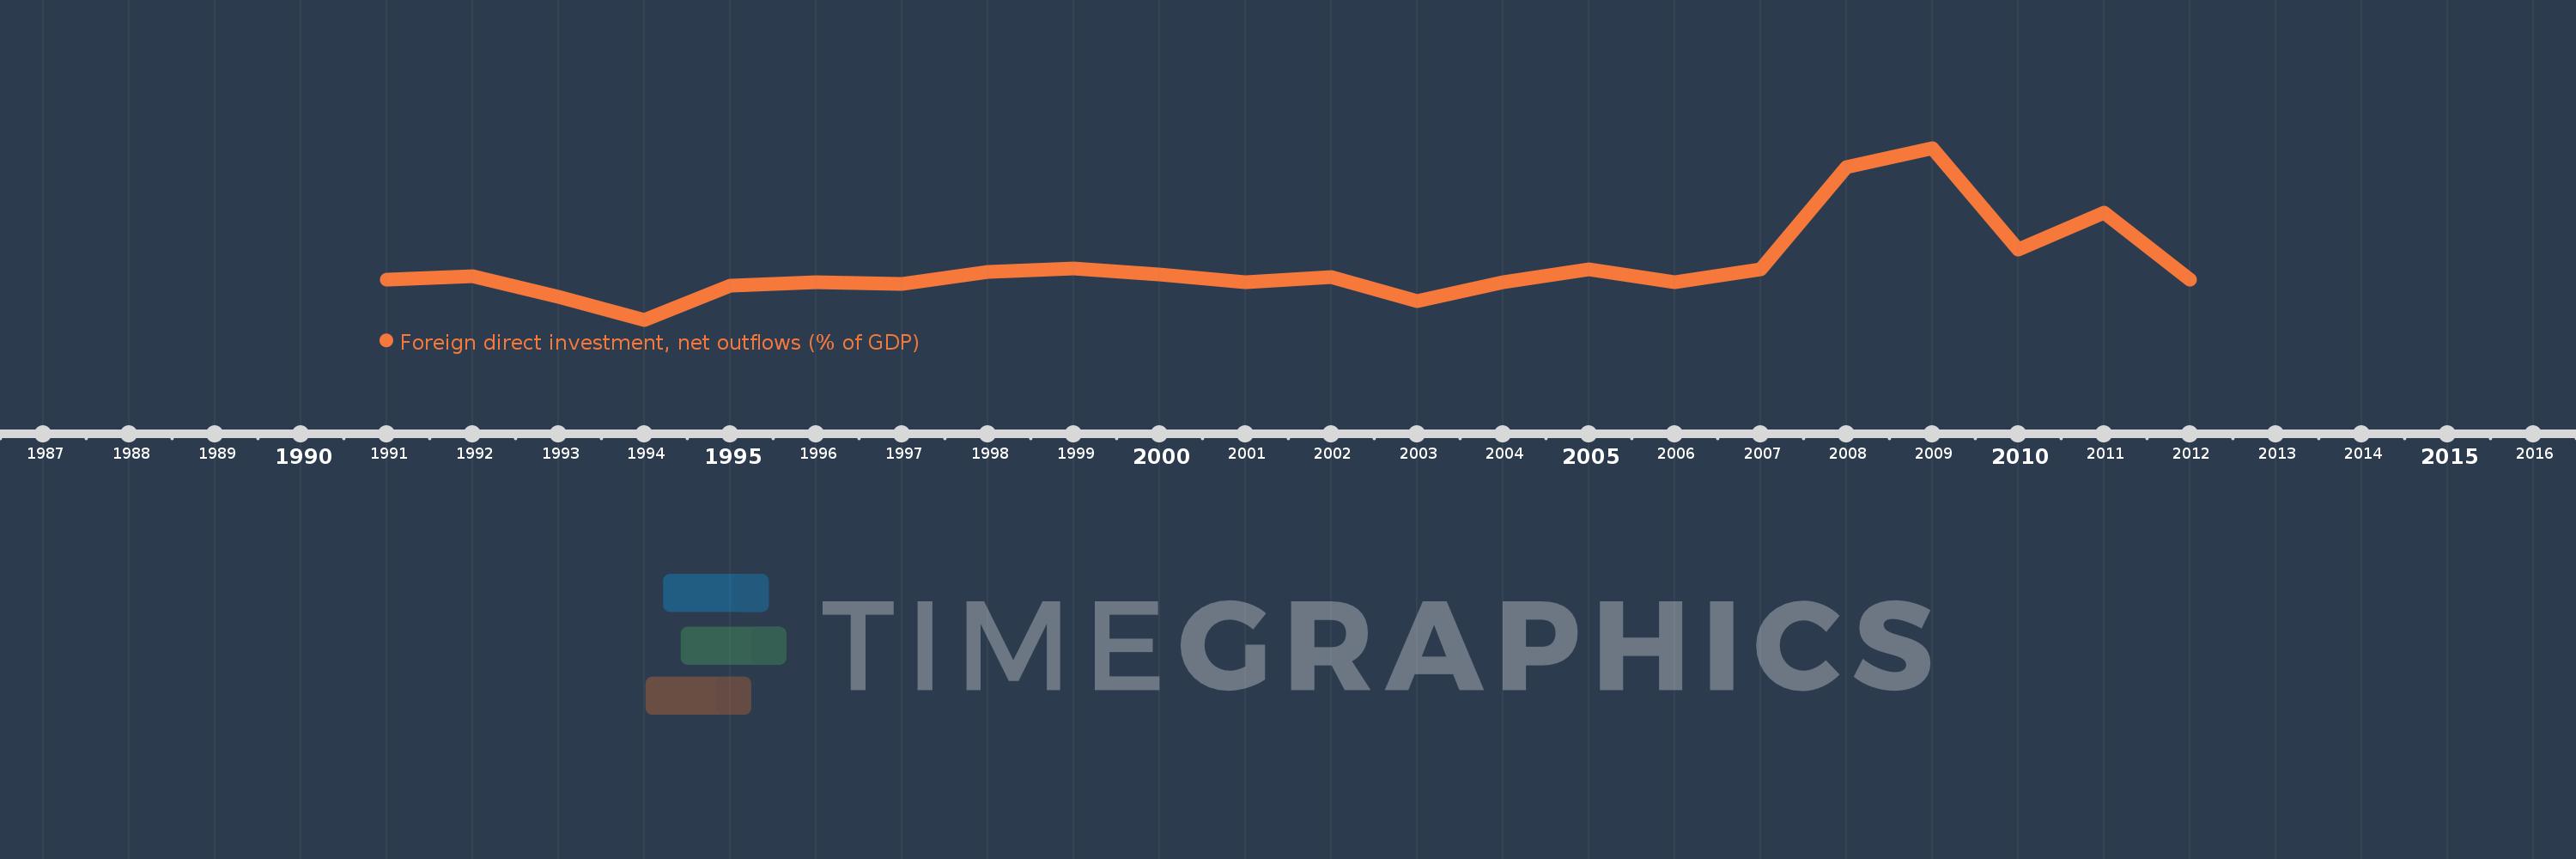
This timeline shows a graph from 1991 to 2012 of Libya. No data until 1990. Number of actual observations by date: 22.
Source name:
World Development Indicators
Source organization:
International Monetary Fund, International Financial Statistics and Balance of Payments databases, World Bank, International Debt Statistics, and World Bank and OECD GDP estimates.
Categories, topics:
Economy & Growth, Financial Sector
Last updated:
apr 23, 2017
Indicators value changes by year
Meaning:
1.026
Minimum:
-1.564
jan 1, 1994
Maximum:
6.757
jan 1, 2009
At the date of observation
Value
Absolute change
Change from the previous value
jan 1, 1991
0.364
+0.364
0.0%
jan 1, 1992
0.543
+0.179
49.22%
jan 1, 1993
-0.444
-0.988
-181.81%
jan 1, 1994
-1.564
-1.119
251.79%
jan 1, 1995
0.09
+1.654
-105.78%
jan 1, 1996
0.269
+0.178
197.54%
jan 1, 1997
0.187
-0.082
-30.33%
jan 1, 1998
0.761
+0.573
306.28%
jan 1, 1999
0.939
+0.178
23.42%
jan 1, 2000
0.628
-0.311
-33.09%
jan 1, 2001
0.256
-0.372
-59.23%
jan 1, 2002
0.513
+0.257
100.35%
jan 1, 2003
-0.664
-1.177
-229.42%
jan 1, 2004
0.24
+0.904
-136.12%
jan 1, 2005
0.863
+0.624
259.99%
jan 1, 2006
0.27
-0.593
-68.68%
jan 1, 2007
0.862
+0.592
218.92%
jan 1, 2008
5.825
+4.963
575.43%
jan 1, 2009
6.757
+0.932
16.0%
jan 1, 2010
1.848
-4.909
-72.65%
jan 1, 2011
3.64
+1.792
96.95%
jan 1, 2012
0.378
-3.263
-89.63%
Ranking of countries by current statistics by years