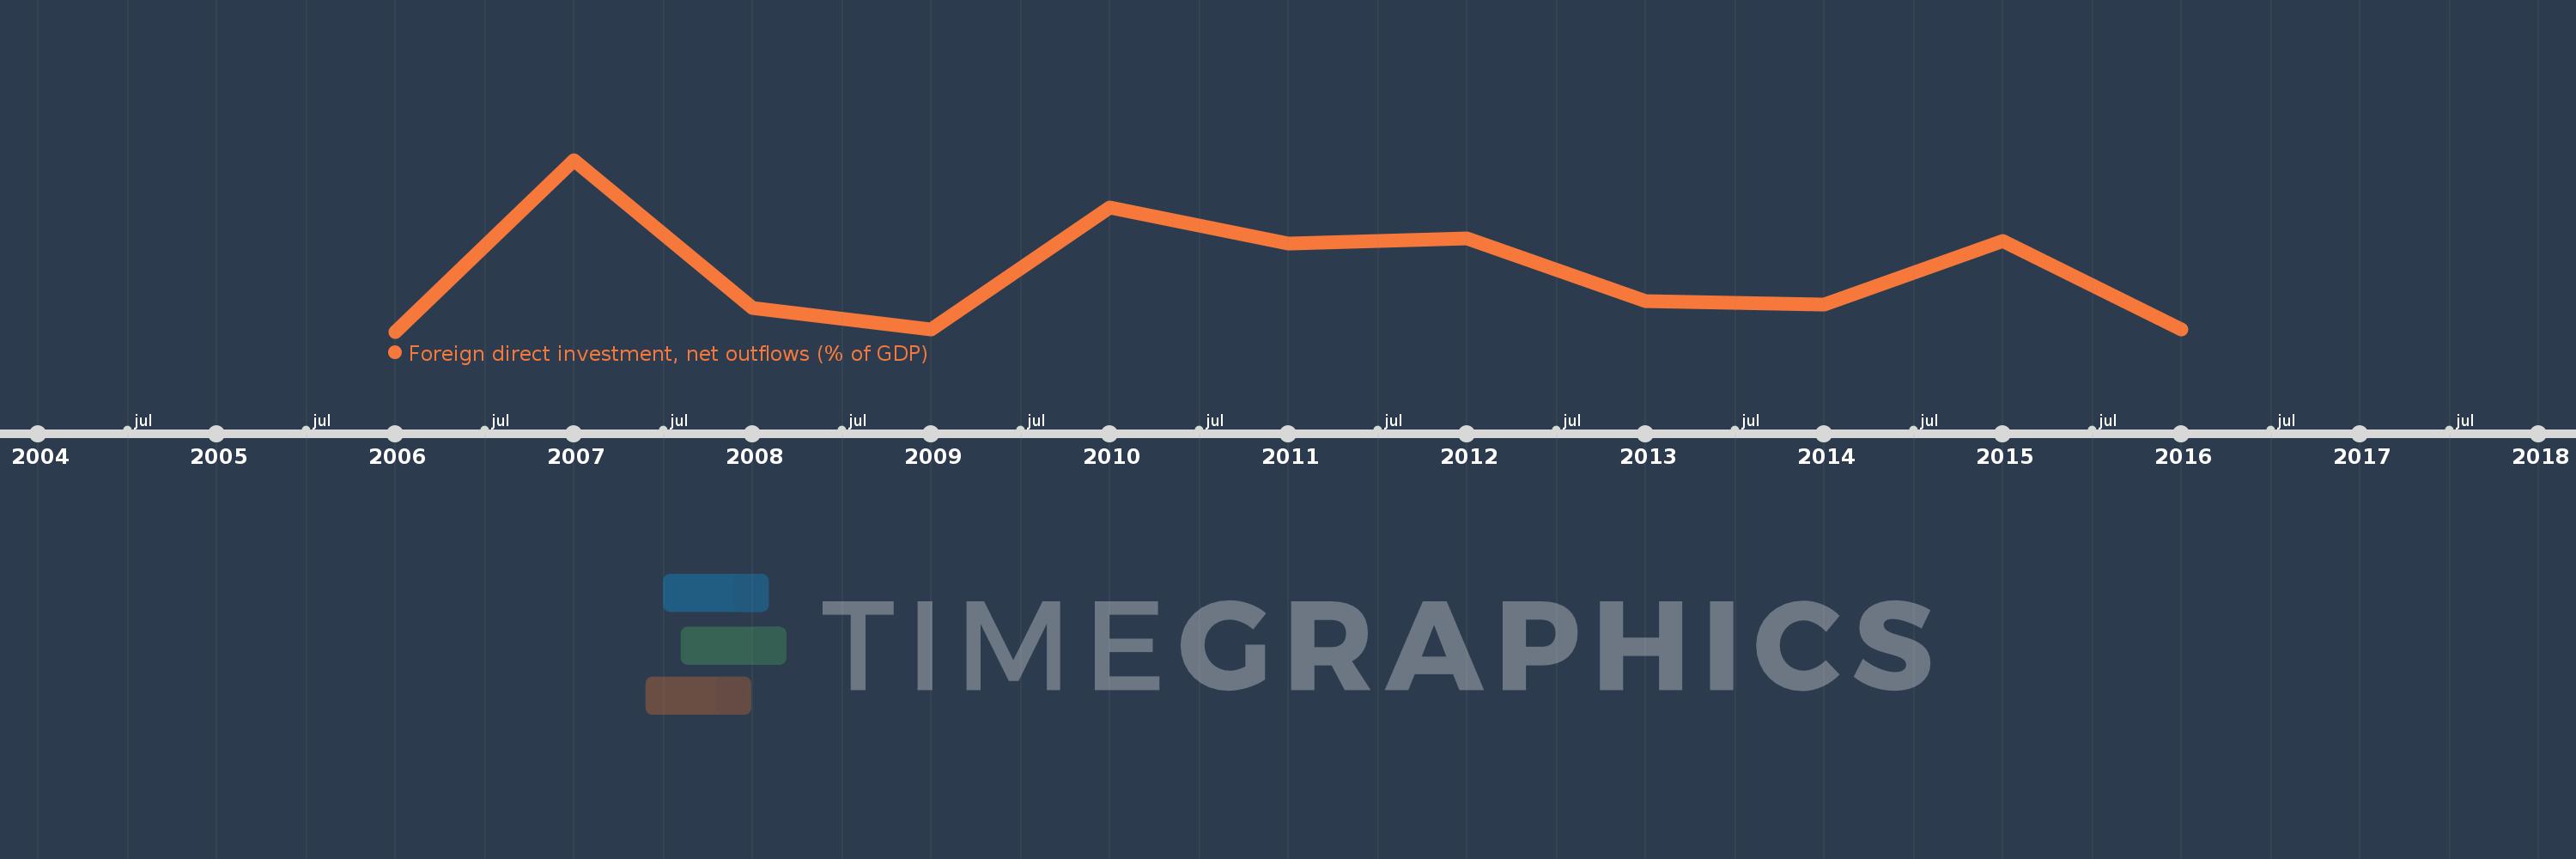
This timeline shows a graph from 2006 to 2016 of Mongolia. No data until 2005. Number of actual observations by date: 11.
Source name:
World Development Indicators
Source organization:
International Monetary Fund, International Financial Statistics and Balance of Payments databases, World Bank, International Debt Statistics, and World Bank and OECD GDP estimates.
Categories, topics:
Economy & Growth, Financial Sector
Last updated:
apr 23, 2017
Indicators value changes by year
Meaning:
0.61
Minimum:
0.091
jan 1, 2006
Maximum:
1.593
jan 1, 2007
At the date of observation
Value
Absolute change
Change from the previous value
jan 1, 2006
0.091
+0.091
0.0%
jan 1, 2007
1.593
+1.502
1.65K%
jan 1, 2008
0.301
-1.292
-81.1%
jan 1, 2009
0.111
-0.19
-63.13%
jan 1, 2010
1.174
+1.063
957.35%
jan 1, 2011
0.859
-0.315
-26.86%
jan 1, 2012
0.908
+0.049
5.72%
jan 1, 2013
0.358
-0.55
-60.56%
jan 1, 2014
0.33
-0.028
-7.94%
jan 1, 2015
0.883
+0.553
167.89%
jan 1, 2016
0.108
-0.775
-87.76%
Ranking of countries by current statistics by years