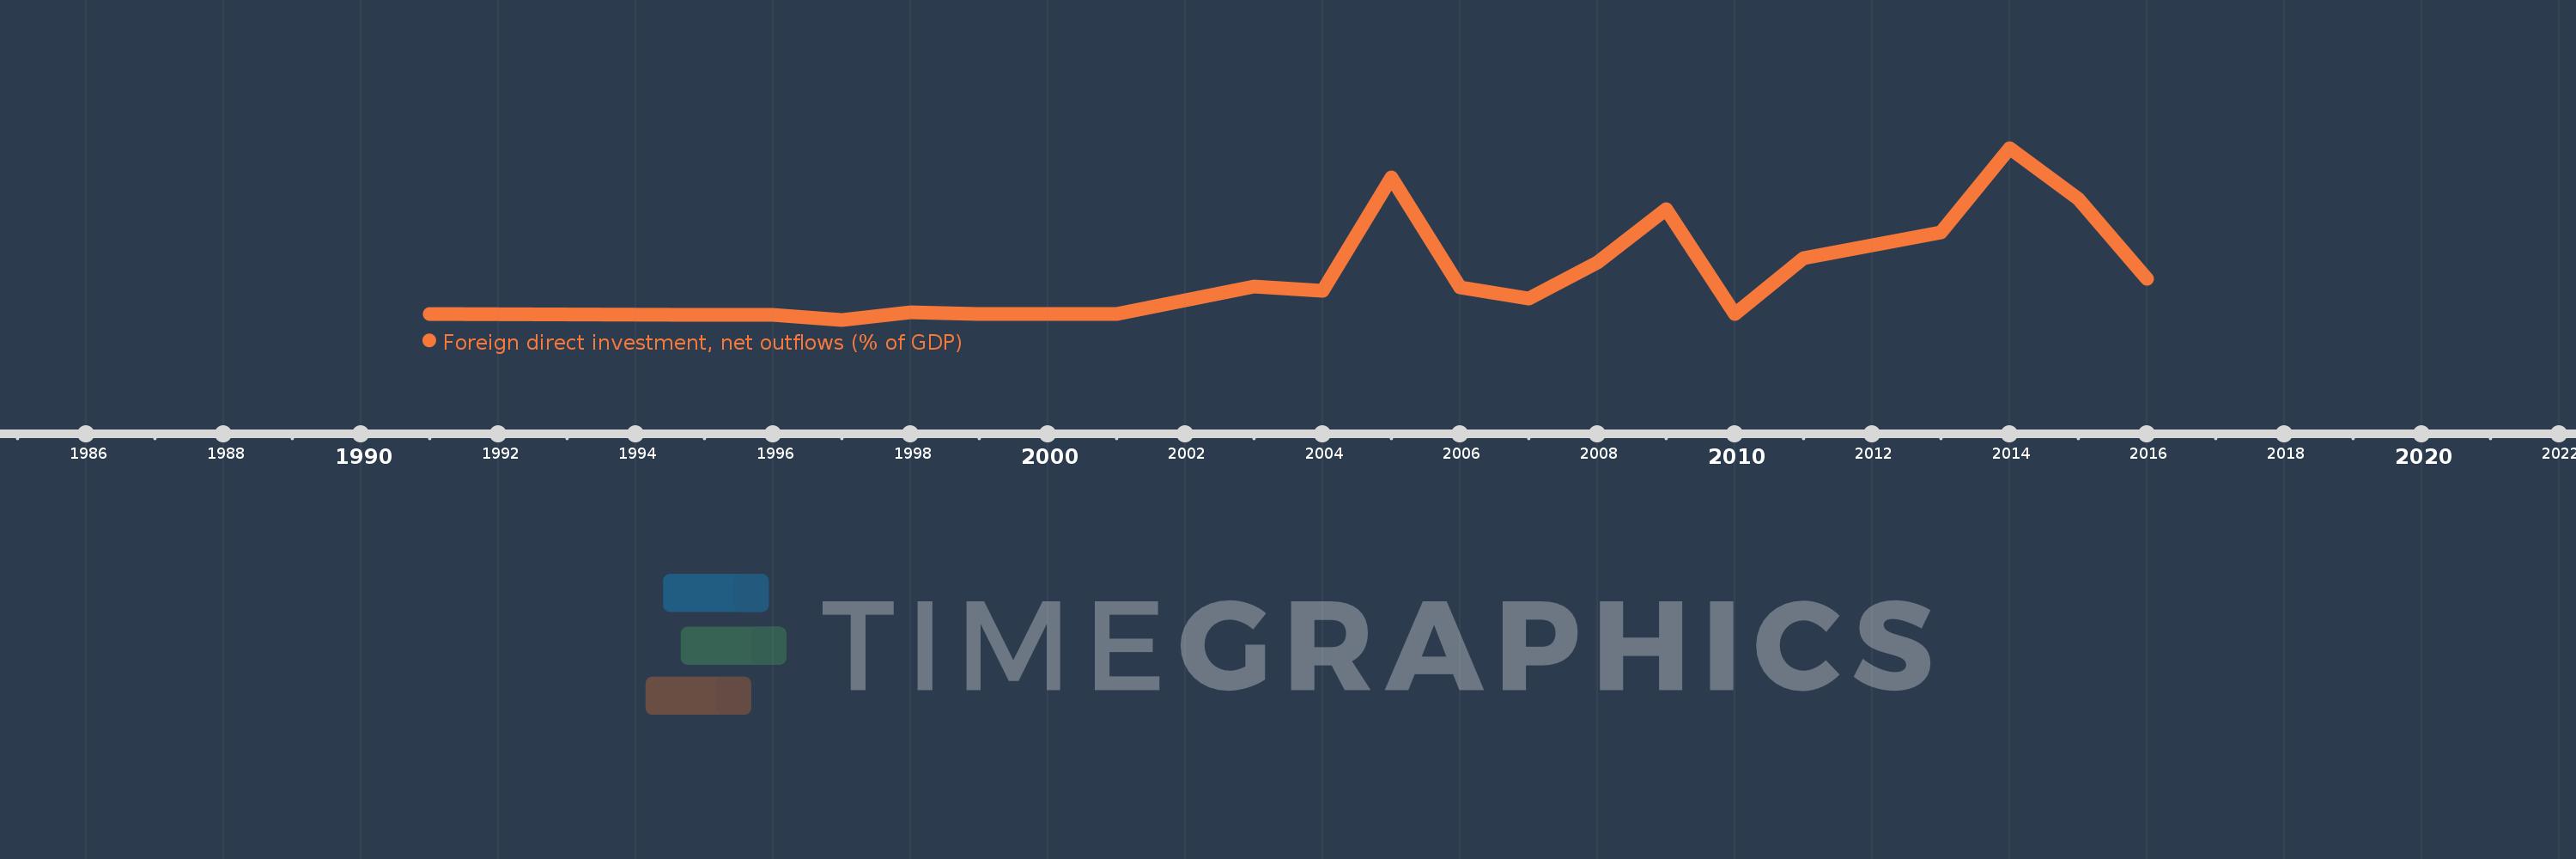
This timeline shows a graph from 1991 to 2016 of Angola. No data until 1990. Number of actual observations by date: 22.
Source name:
World Development Indicators
Source organization:
International Monetary Fund, International Financial Statistics and Balance of Payments databases, World Bank, International Debt Statistics, and World Bank and OECD GDP estimates.
Categories, topics:
Economy & Growth, Financial Sector
Last updated:
apr 23, 2017
Indicators value changes by year
Meaning:
1.197
Minimum:
-0.165
jan 1, 1997
Maximum:
4.839
jan 1, 2014
At the date of observation
Value
Absolute change
Change from the previous value
jan 1, 1991
0.009
+0.009
0.0%
jan 1, 1995
-0.032
-0.041
-459.51%
jan 1, 1996
-0.02
+0.012
-36.45%
jan 1, 1997
-0.165
-0.145
705.18%
jan 1, 1998
0.052
+0.217
-131.48%
jan 1, 1999
0.0
-0.052
-100.0%
jan 1, 2000
-0.001
-0.001
%
jan 1, 2001
0.0
+0.001
-100.0%
jan 1, 2003
0.801
+0.801
%
jan 1, 2004
0.676
-0.125
-15.63%
jan 1, 2005
3.988
+3.312
490.02%
jan 1, 2006
0.777
-3.211
-80.52%
jan 1, 2007
0.456
-0.321
-41.3%
jan 1, 2008
1.508
+1.052
230.74%
jan 1, 2009
3.053
+1.544
102.38%
jan 1, 2010
0.009
-3.044
-99.71%
jan 1, 2011
1.625
+1.616
18.07K%
jan 1, 2012
2.01
+0.385
23.66%
jan 1, 2013
2.375
+0.365
18.17%
jan 1, 2014
4.839
+2.464
103.73%
jan 1, 2015
3.355
-1.484
-30.67%
jan 1, 2016
1.02
-2.335
-69.6%
Ranking of countries by current statistics by years