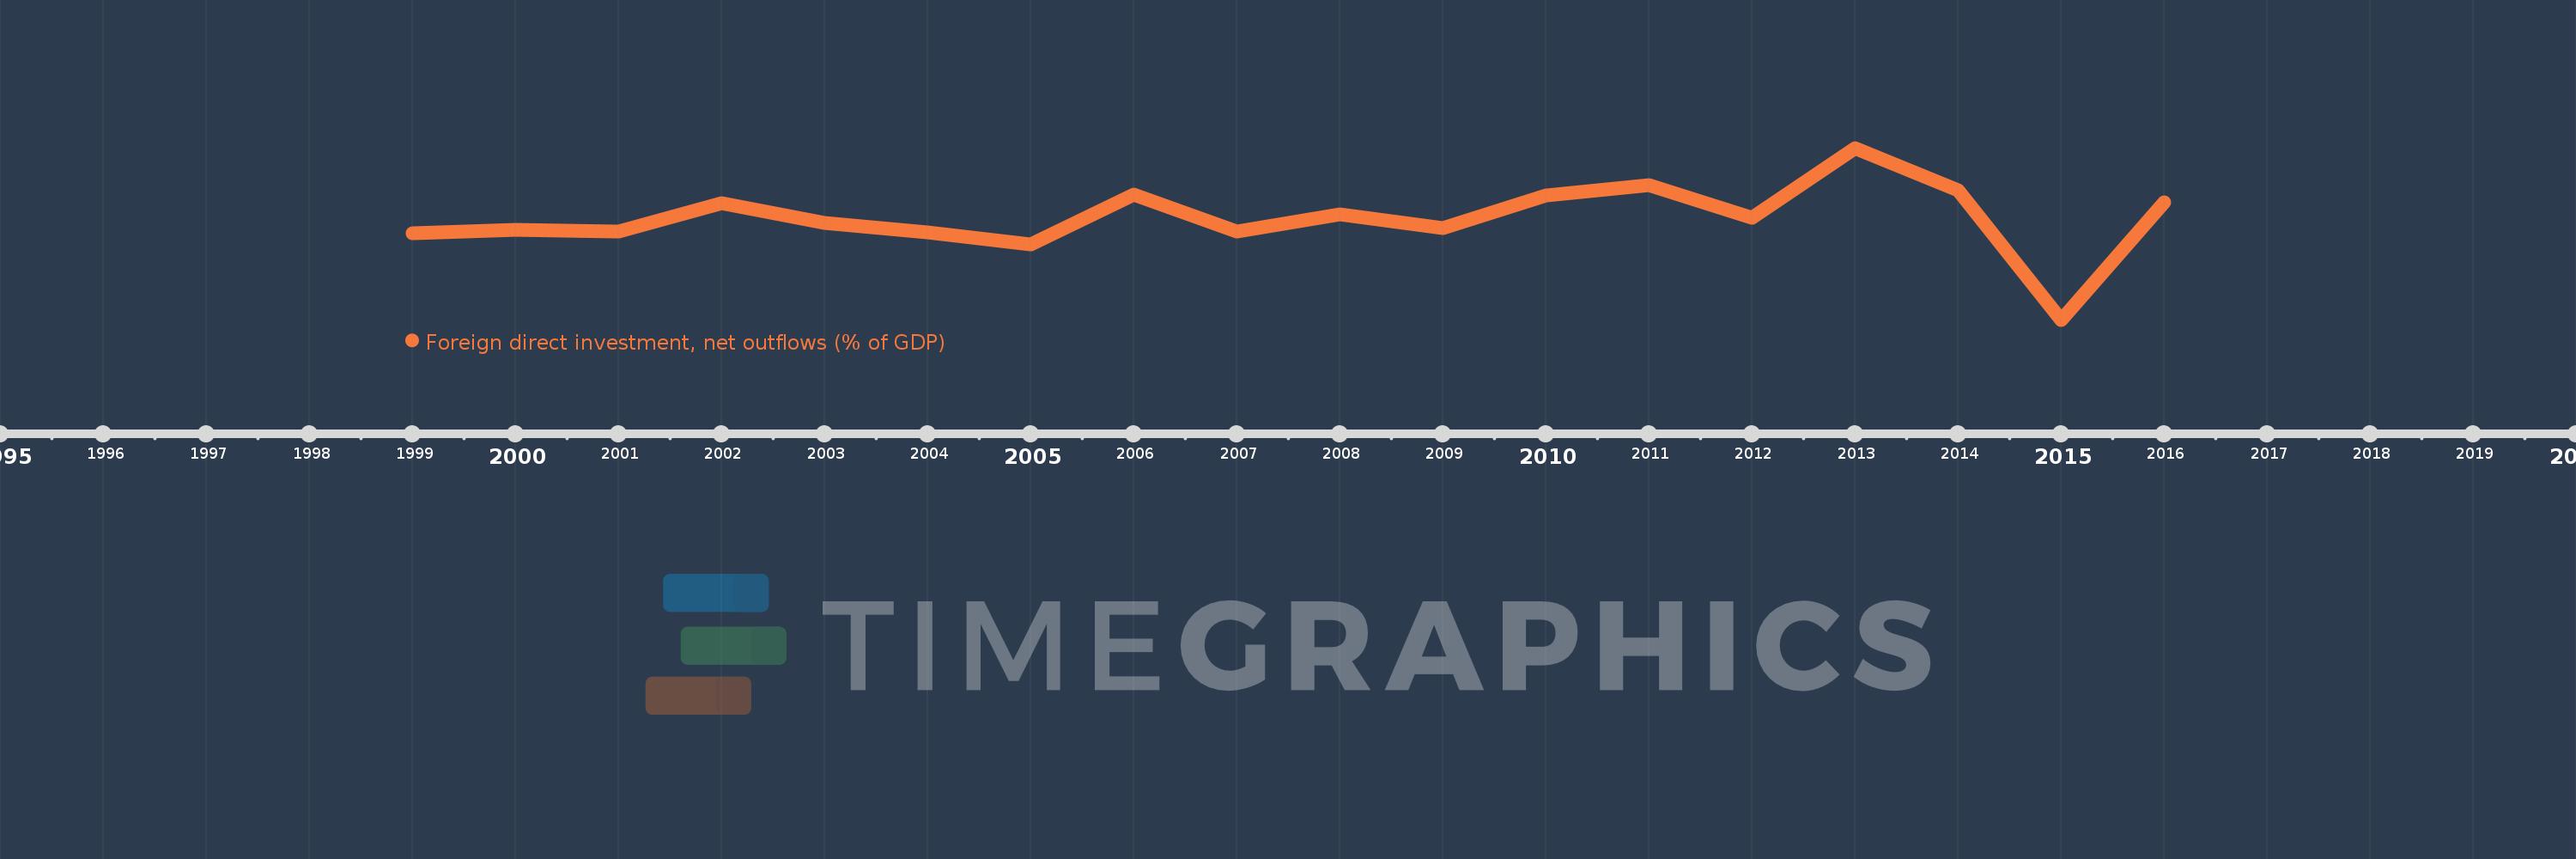
This timeline shows a graph from 1999 to 2016 of Macedonia, FYR. No data until 1998. Number of actual observations by date: 18.
Source name:
World Development Indicators
Source organization:
International Monetary Fund, International Financial Statistics and Balance of Payments databases, World Bank, International Debt Statistics, and World Bank and OECD GDP estimates.
Categories, topics:
Economy & Growth, Financial Sector
Last updated:
apr 23, 2017
Indicators value changes by year
Meaning:
0.326
Minimum:
-1.771
jan 1, 2015
Maximum:
1.769
jan 1, 2013
At the date of observation
Value
Absolute change
Change from the previous value
jan 1, 1999
0.019
+0.019
0.0%
jan 1, 2000
0.088
+0.069
357.73%
jan 1, 2001
0.049
-0.039
-44.18%
jan 1, 2002
0.628
+0.579
1.18K%
jan 1, 2003
0.217
-0.411
-65.45%
jan 1, 2004
0.032
-0.185
-85.29%
jan 1, 2005
-0.224
-0.256
-801.66%
jan 1, 2006
0.816
+1.04
-464.48%
jan 1, 2007
0.051
-0.766
-93.78%
jan 1, 2008
0.4
+0.349
687.3%
jan 1, 2009
0.113
-0.287
-71.75%
jan 1, 2010
0.787
+0.674
597.26%
jan 1, 2011
1.005
+0.218
27.74%
jan 1, 2012
0.324
-0.681
-67.77%
jan 1, 2013
1.769
+1.445
445.95%
jan 1, 2014
0.901
-0.868
-49.06%
jan 1, 2015
-1.771
-2.673
-296.58%
jan 1, 2016
0.657
+2.429
-137.1%
Ranking of countries by current statistics by years