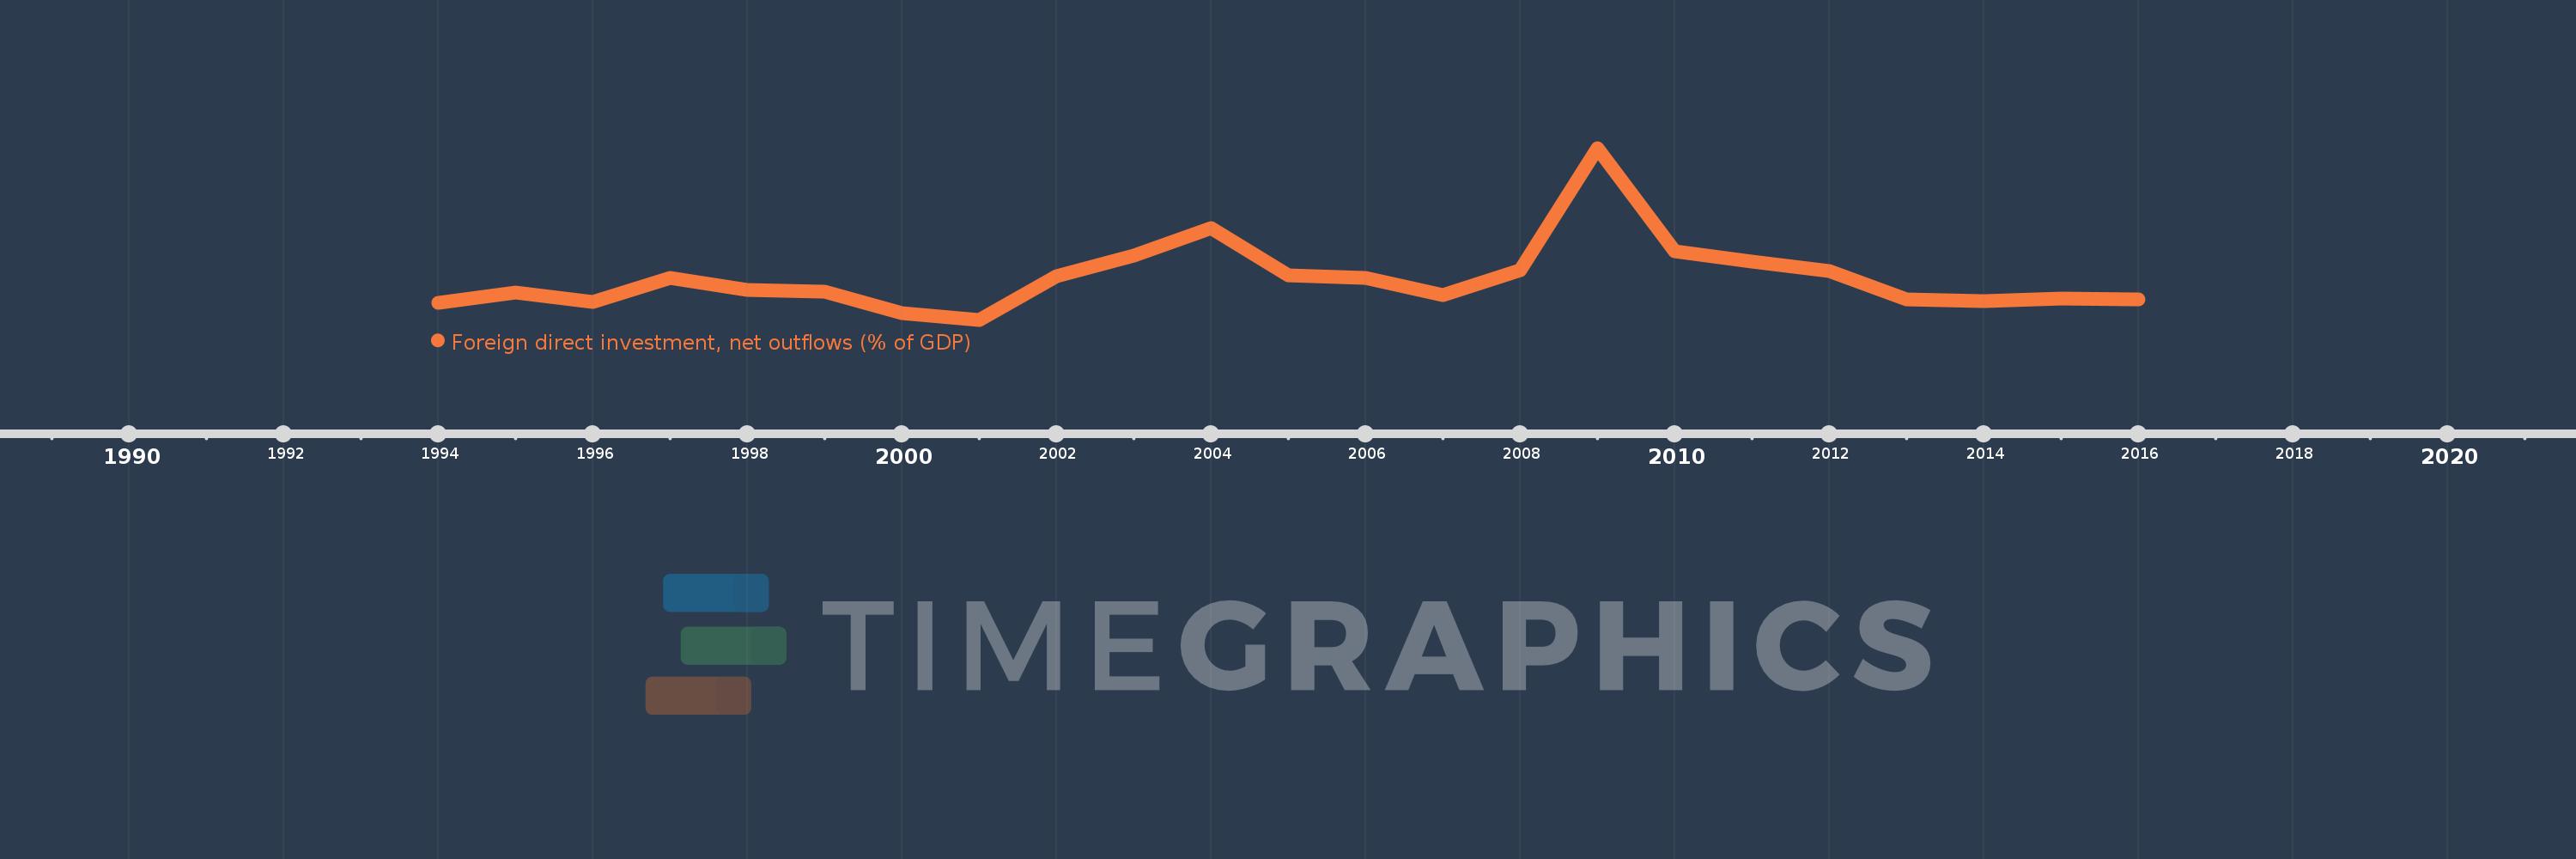
This timeline shows a graph from 1994 to 2016 of Yemen, Rep.. No data until 1993. Number of actual observations by date: 23.
Source name:
World Development Indicators
Source organization:
International Monetary Fund, International Financial Statistics and Balance of Payments databases, World Bank, International Debt Statistics, and World Bank and OECD GDP estimates.
Categories, topics:
Economy & Growth, Financial Sector
Last updated:
apr 23, 2017
Indicators value changes by year
Meaning:
0.139
Minimum:
-0.089
jan 1, 2001
Maximum:
0.854
jan 1, 2009
At the date of observation
Value
Absolute change
Change from the previous value
jan 1, 1994
0.004
+0.004
0.0%
jan 1, 1995
0.059
+0.055
1.45K%
jan 1, 1996
0.009
-0.049
-83.94%
jan 1, 1997
0.142
+0.132
1.41K%
jan 1, 1998
0.074
-0.067
-47.51%
jan 1, 1999
0.063
-0.011
-14.86%
jan 1, 2000
-0.052
-0.116
-182.64%
jan 1, 2001
-0.089
-0.037
69.86%
jan 1, 2002
0.148
+0.237
-266.86%
jan 1, 2003
0.263
+0.114
77.16%
jan 1, 2004
0.415
+0.152
58.03%
jan 1, 2005
0.155
-0.26
-62.58%
jan 1, 2006
0.141
-0.014
-9.17%
jan 1, 2007
0.048
-0.093
-65.65%
jan 1, 2008
0.182
+0.134
276.16%
jan 1, 2009
0.854
+0.672
368.43%
jan 1, 2010
0.286
-0.568
-66.51%
jan 1, 2011
0.23
-0.056
-19.57%
jan 1, 2012
0.177
-0.053
-23.11%
jan 1, 2013
0.024
-0.153
-86.5%
jan 1, 2014
0.012
-0.012
-50.06%
jan 1, 2015
0.027
+0.015
124.81%
jan 1, 2016
0.022
-0.005
-18.08%
Ranking of countries by current statistics by years