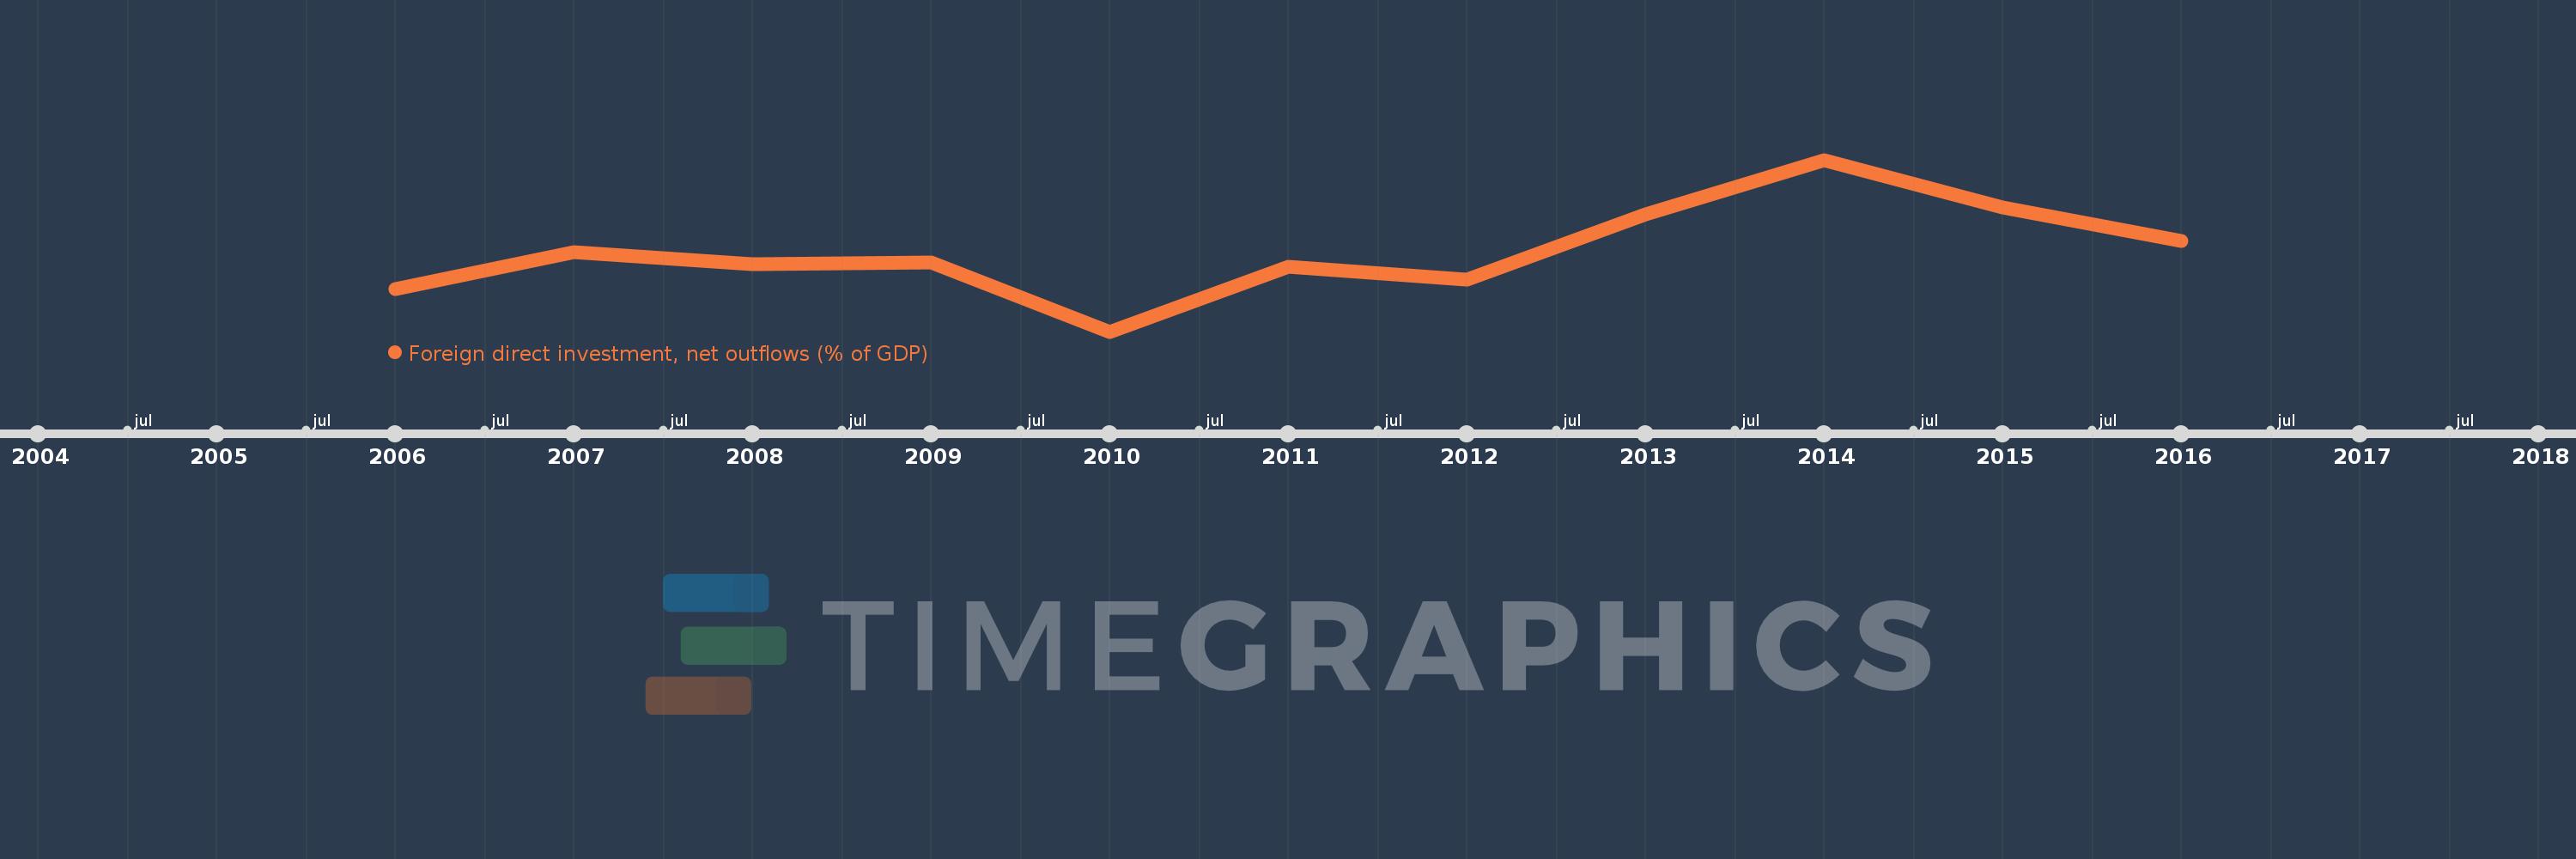
This timeline shows a graph from 2006 to 2016 of Nicaragua. No data until 2005. Number of actual observations by date: 11.
Source name:
World Development Indicators
Source organization:
International Monetary Fund, International Financial Statistics and Balance of Payments databases, World Bank, International Debt Statistics, and World Bank and OECD GDP estimates.
Categories, topics:
Economy & Growth, Financial Sector
Last updated:
apr 23, 2017
Indicators value changes by year
Meaning:
0.311
Minimum:
-0.347
jan 1, 2010
Maximum:
1.067
jan 1, 2014
At the date of observation
Value
Absolute change
Change from the previous value
jan 1, 2006
0.0
0.0
0.0%
jan 1, 2007
0.309
+0.309
%
jan 1, 2008
0.205
-0.104
-33.71%
jan 1, 2009
0.223
+0.017
8.5%
jan 1, 2010
-0.347
-0.57
-256.0%
jan 1, 2011
0.188
+0.535
-154.03%
jan 1, 2012
0.079
-0.109
-57.93%
jan 1, 2013
0.62
+0.541
685.26%
jan 1, 2014
1.067
+0.447
72.1%
jan 1, 2015
0.678
-0.389
-36.47%
jan 1, 2016
0.398
-0.28
-41.29%
Ranking of countries by current statistics by years