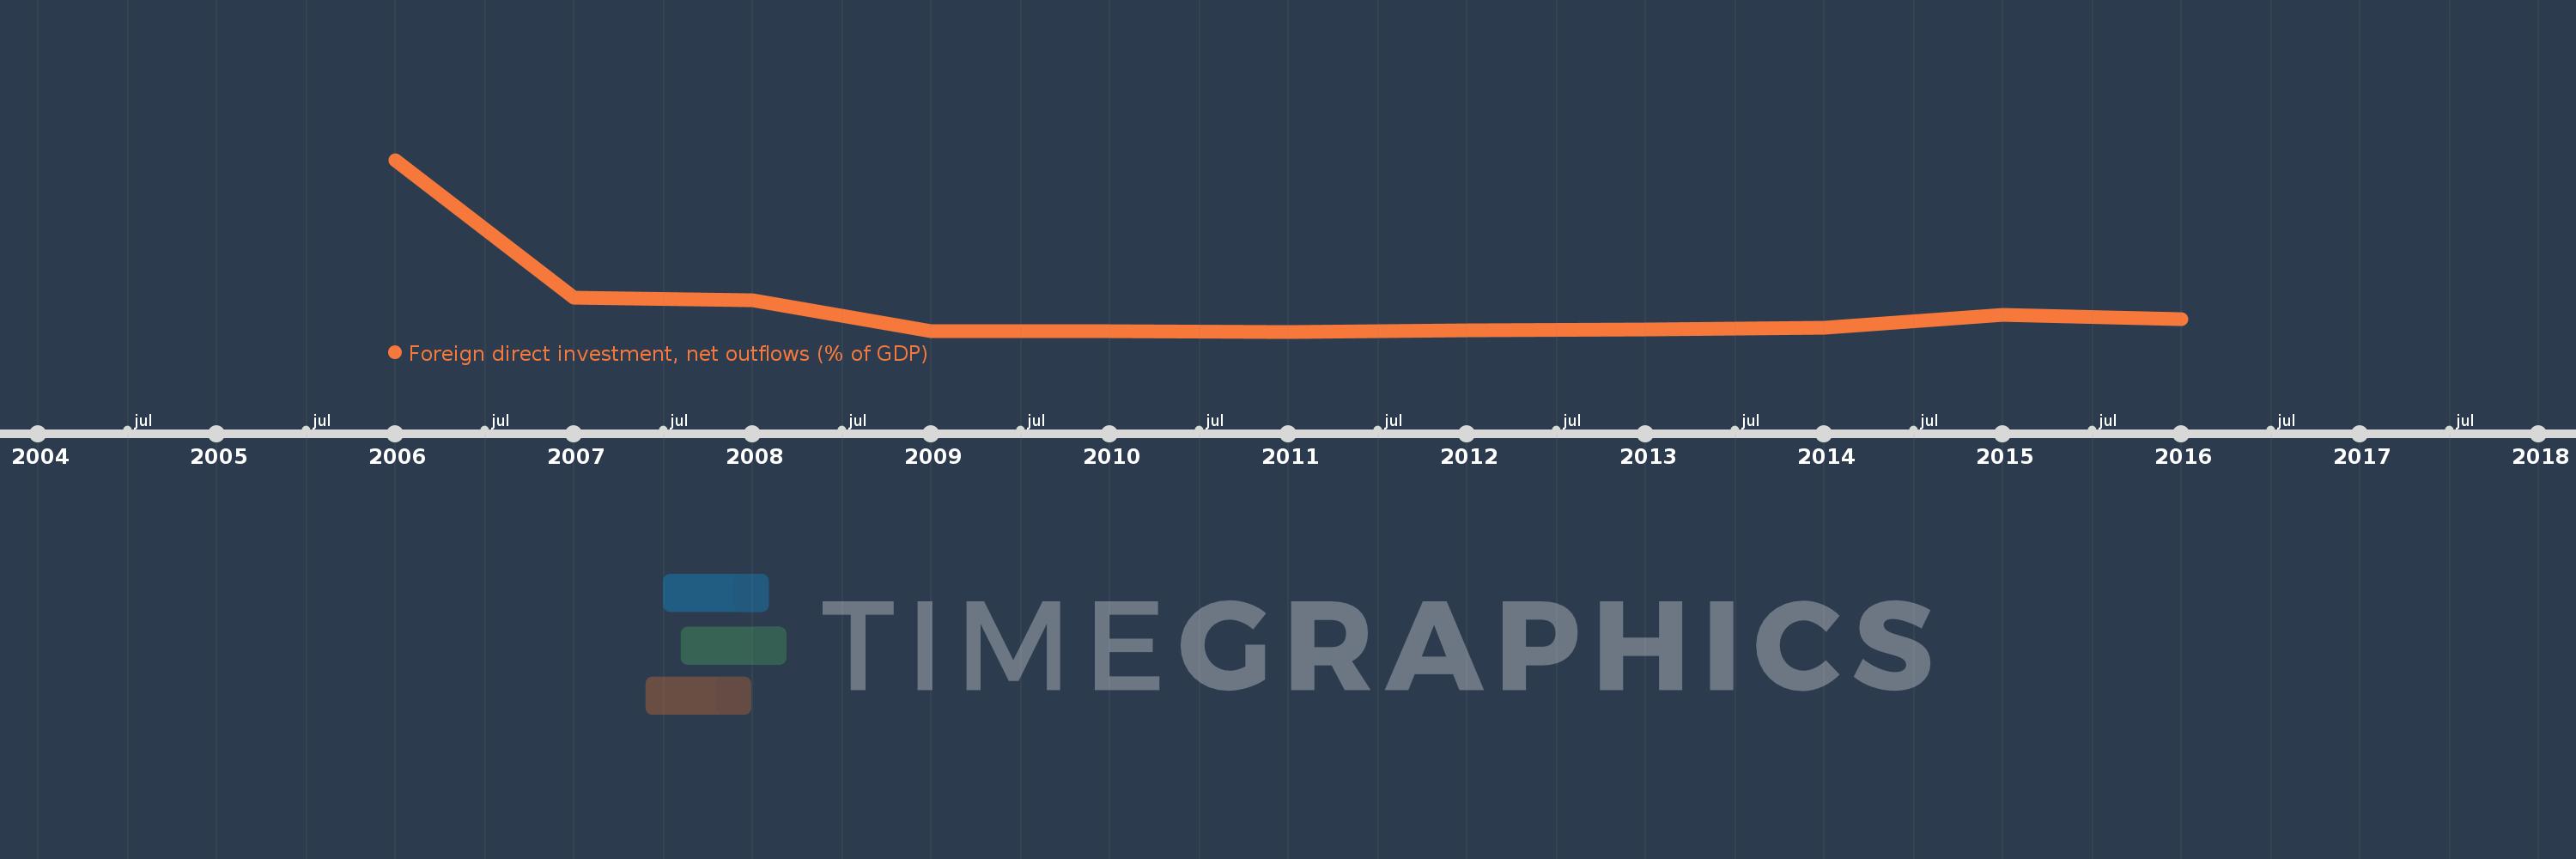
This timeline shows a graph from 2006 to 2016 of Sao Tome and Principe. No data until 2005. Number of actual observations by date: 11.
Source name:
World Development Indicators
Source organization:
International Monetary Fund, International Financial Statistics and Balance of Payments databases, World Bank, International Debt Statistics, and World Bank and OECD GDP estimates.
Categories, topics:
Economy & Growth, Financial Sector
Last updated:
apr 23, 2017
Indicators value changes by year
Meaning:
1.697
Minimum:
0.028
jan 1, 2011
Maximum:
11.532
jan 1, 2006
At the date of observation
Value
Absolute change
Change from the previous value
jan 1, 2006
11.532
+11.532
0.0%
jan 1, 2007
2.283
-9.249
-80.21%
jan 1, 2008
2.142
-0.141
-6.17%
jan 1, 2009
0.05
-2.092
-97.65%
jan 1, 2010
0.08
+0.03
59.06%
jan 1, 2011
0.028
-0.052
-65.05%
jan 1, 2012
0.127
+0.099
355.74%
jan 1, 2013
0.159
+0.032
25.12%
jan 1, 2014
0.3
+0.141
88.41%
jan 1, 2015
1.128
+0.828
275.49%
jan 1, 2016
0.836
-0.293
-25.93%
Ranking of countries by current statistics by years