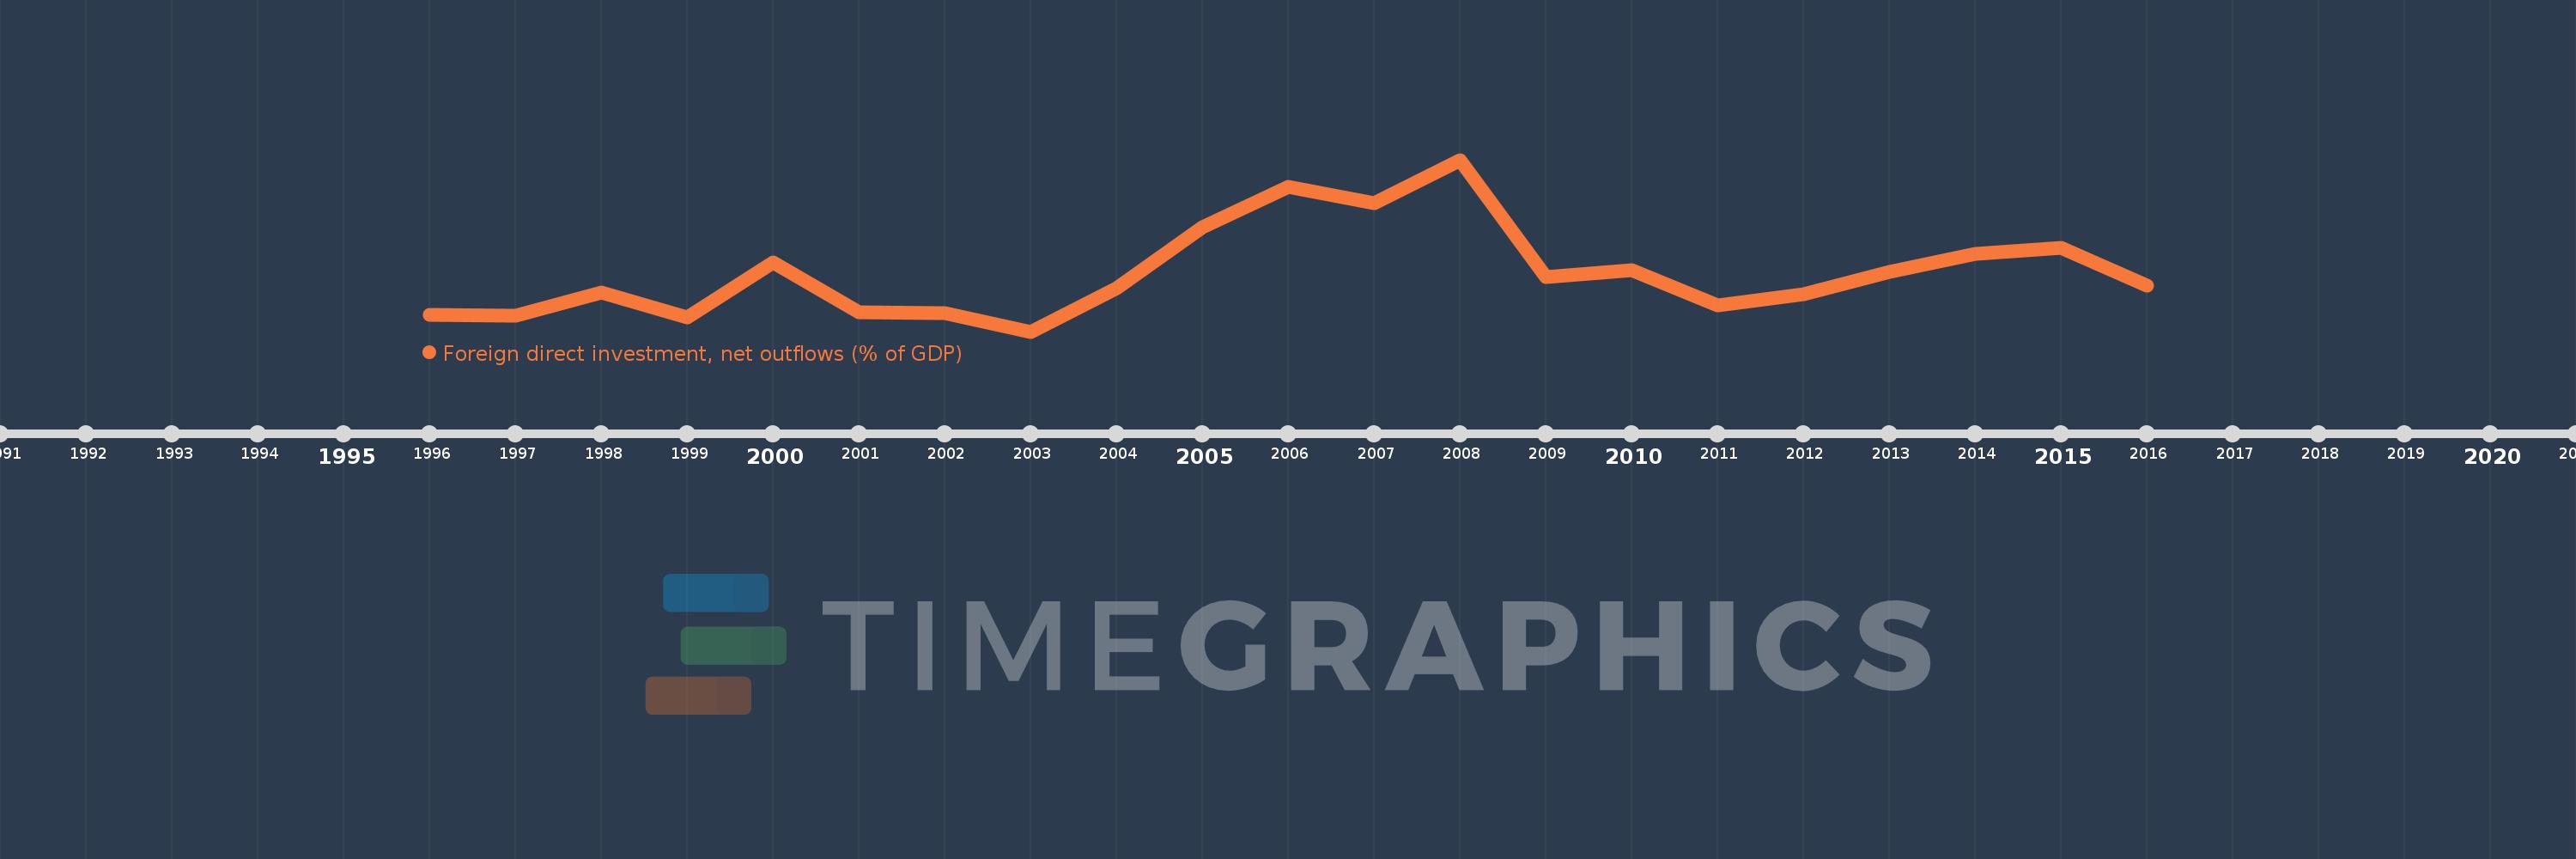
This timeline shows a graph from 1996 to 2016 of Lithuania. No data until 1995. Number of actual observations by date: 21.
Source name:
World Development Indicators
Source organization:
International Monetary Fund, International Financial Statistics and Balance of Payments databases, World Bank, International Debt Statistics, and World Bank and OECD GDP estimates.
Categories, topics:
Economy & Growth, Financial Sector
Last updated:
apr 23, 2017
Indicators value changes by year
Meaning:
0.632
Minimum:
-0.238
jan 1, 2003
Maximum:
2.308
jan 1, 2008
At the date of observation
Value
Absolute change
Change from the previous value
jan 1, 1996
0.013
+0.013
0.0%
jan 1, 1997
0.001
-0.011
-88.3%
jan 1, 1998
0.343
+0.341
22.89K%
jan 1, 1999
-0.023
-0.365
-106.62%
jan 1, 2000
0.79
+0.813
-3.58K%
jan 1, 2001
0.044
-0.746
-94.41%
jan 1, 2002
0.03
-0.014
-32.1%
jan 1, 2003
-0.238
-0.268
-893.64%
jan 1, 2004
0.401
+0.639
-268.49%
jan 1, 2005
1.314
+0.912
227.49%
jan 1, 2006
1.912
+0.599
45.57%
jan 1, 2007
1.661
-0.252
-13.16%
jan 1, 2008
2.308
+0.647
38.98%
jan 1, 2009
0.567
-1.741
-75.45%
jan 1, 2010
0.676
+0.109
19.25%
jan 1, 2011
0.154
-0.522
-77.26%
jan 1, 2012
0.321
+0.168
109.18%
jan 1, 2013
0.641
+0.32
99.59%
jan 1, 2014
0.92
+0.279
43.44%
jan 1, 2015
1.008
+0.088
9.57%
jan 1, 2016
0.438
-0.57
-56.56%
Ranking of countries by current statistics by years