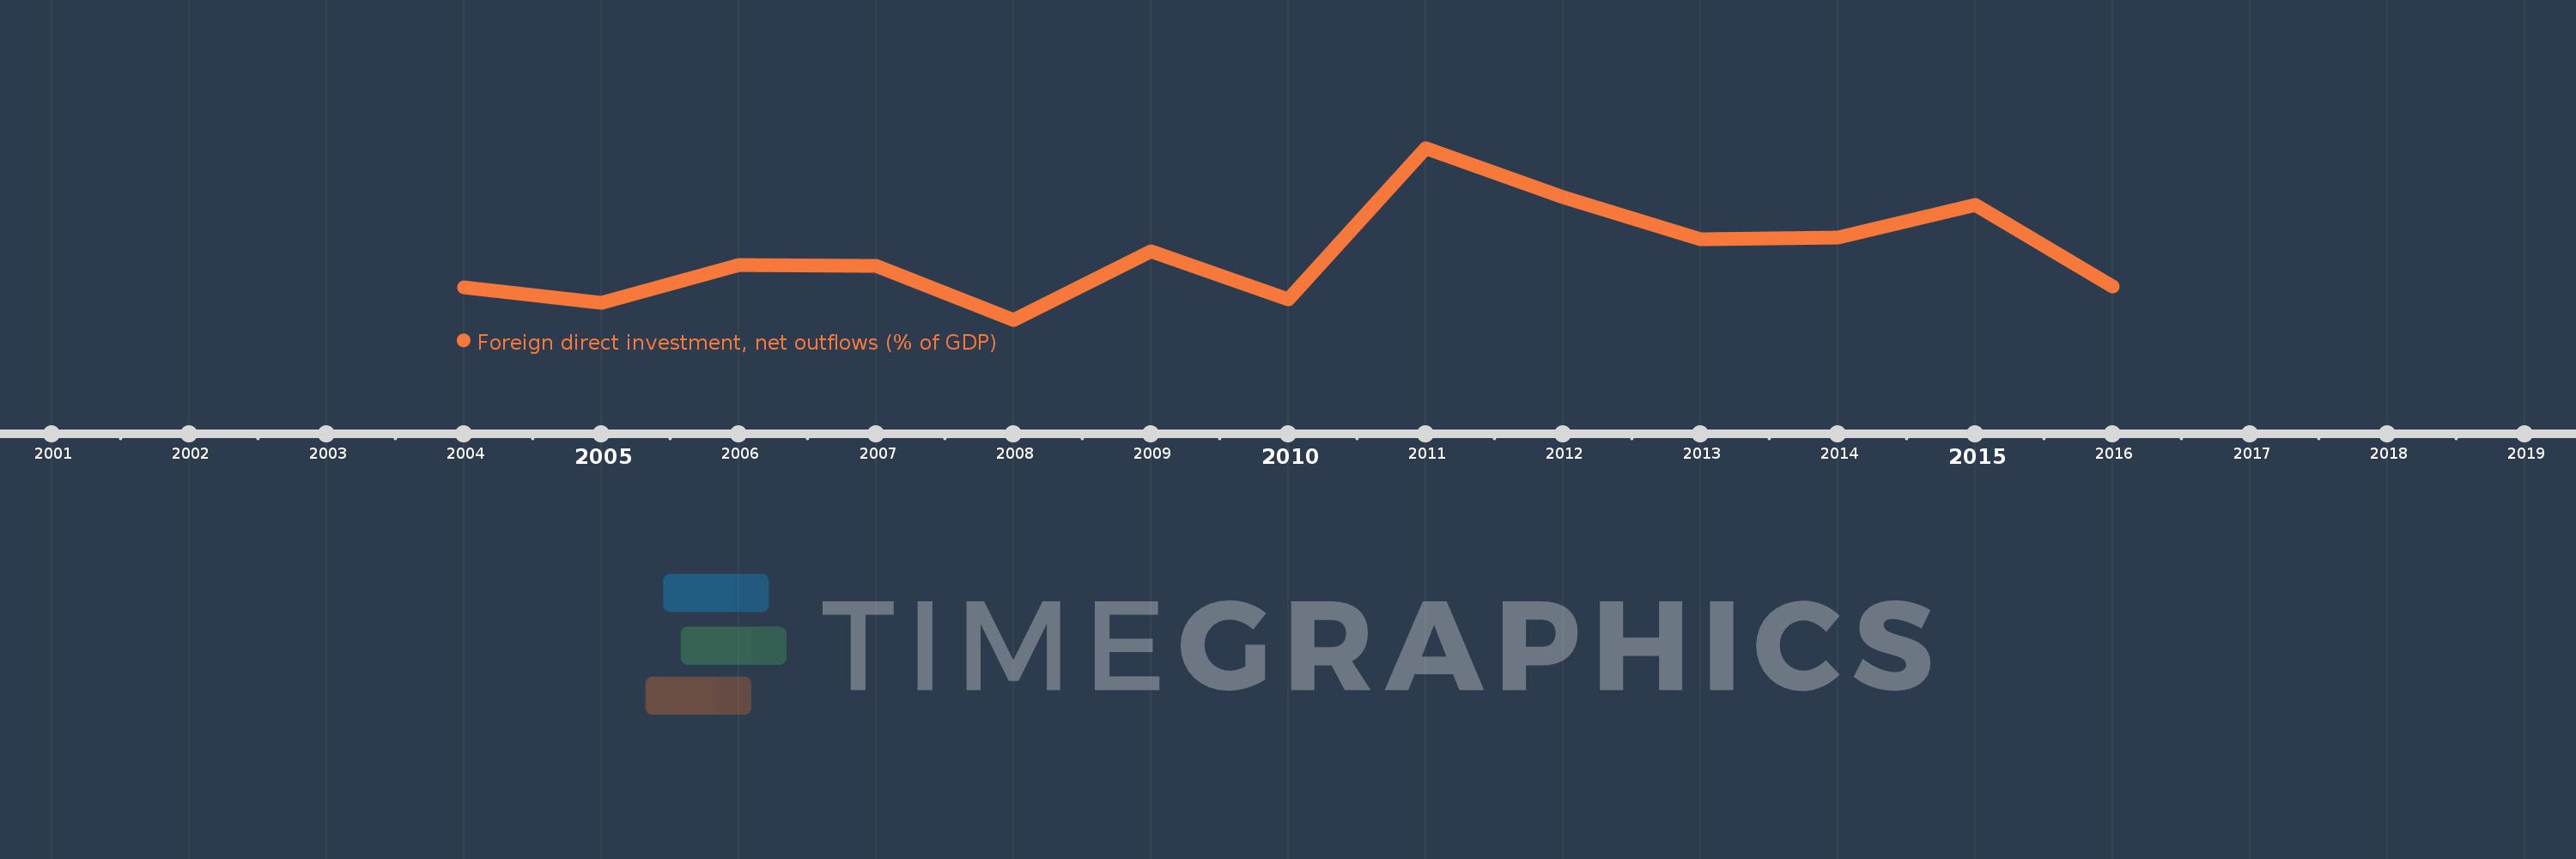
This timeline shows a graph from 2004 to 2016 of Oman. No data until 2003. Number of actual observations by date: 13.
Source name:
World Development Indicators
Source organization:
International Monetary Fund, International Financial Statistics and Balance of Payments databases, World Bank, International Debt Statistics, and World Bank and OECD GDP estimates.
Categories, topics:
Economy & Growth, Financial Sector
Last updated:
apr 23, 2017
Indicators value changes by year
Meaning:
0.919
Minimum:
-0.088
jan 1, 2008
Maximum:
2.555
jan 1, 2011
At the date of observation
Value
Absolute change
Change from the previous value
jan 1, 2004
0.407
+0.407
0.0%
jan 1, 2005
0.17
-0.237
-58.3%
jan 1, 2006
0.751
+0.582
343.03%
jan 1, 2007
0.738
-0.013
-1.79%
jan 1, 2008
-0.088
-0.826
-111.97%
jan 1, 2009
0.96
+1.048
-1.19K%
jan 1, 2010
0.226
-0.734
-76.47%
jan 1, 2011
2.555
+2.329
1.03K%
jan 1, 2012
1.8
-0.755
-29.54%
jan 1, 2013
1.154
-0.646
-35.89%
jan 1, 2014
1.183
+0.029
2.49%
jan 1, 2015
1.674
+0.491
41.51%
jan 1, 2016
0.422
-1.252
-74.81%
Ranking of countries by current statistics by years