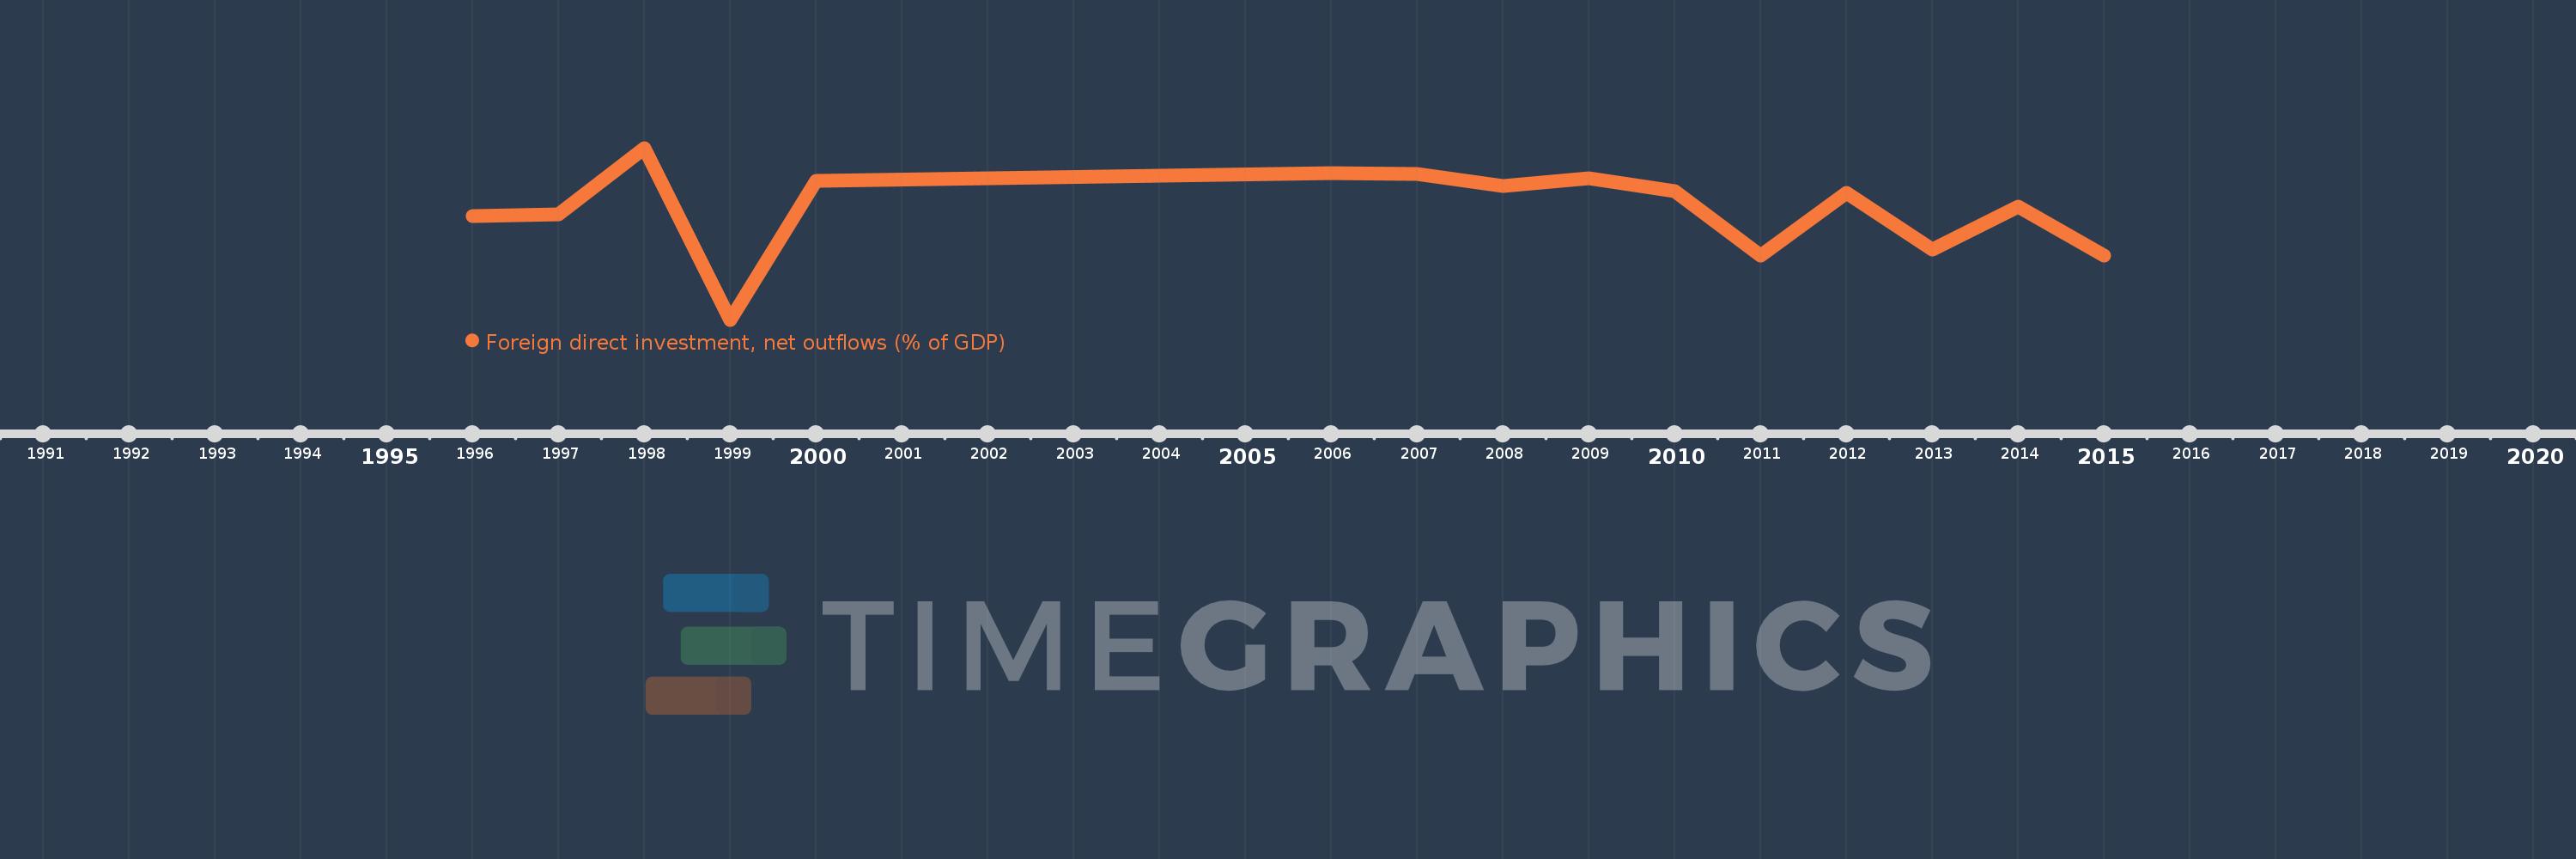
This timeline shows a graph from 1996 to 2015 of IDA only. No data until 1995. Number of actual observations by date: 15.
Source name:
World Development Indicators
Source organization:
International Monetary Fund, International Financial Statistics and Balance of Payments databases, World Bank, International Debt Statistics, and World Bank and OECD GDP estimates.
Categories, topics:
Economy & Growth, Financial Sector
Last updated:
apr 23, 2017
Indicators value changes by year
Meaning:
0.039
Minimum:
-0.594
jan 1, 1999
Maximum:
0.392
jan 1, 1998
At the date of observation
Value
Absolute change
Change from the previous value
jan 1, 1996
-0.001
-0.001
0.0%
jan 1, 1997
0.009
+0.01
-866.3%
jan 1, 1998
0.392
+0.383
4.22K%
jan 1, 1999
-0.594
-0.985
-251.51%
jan 1, 2000
0.203
+0.797
-134.25%
jan 1, 2006
0.247
+0.044
21.5%
jan 1, 2007
0.244
-0.003
-1.38%
jan 1, 2008
0.172
-0.071
-29.27%
jan 1, 2009
0.219
+0.046
26.85%
jan 1, 2010
0.142
-0.077
-35.12%
jan 1, 2011
-0.224
-0.365
-257.62%
jan 1, 2012
0.135
+0.358
-160.22%
jan 1, 2013
-0.191
-0.326
-241.81%
jan 1, 2014
0.054
+0.245
-128.11%
jan 1, 2015
-0.228
-0.282
-524.8%
Ranking of countries by current statistics by years