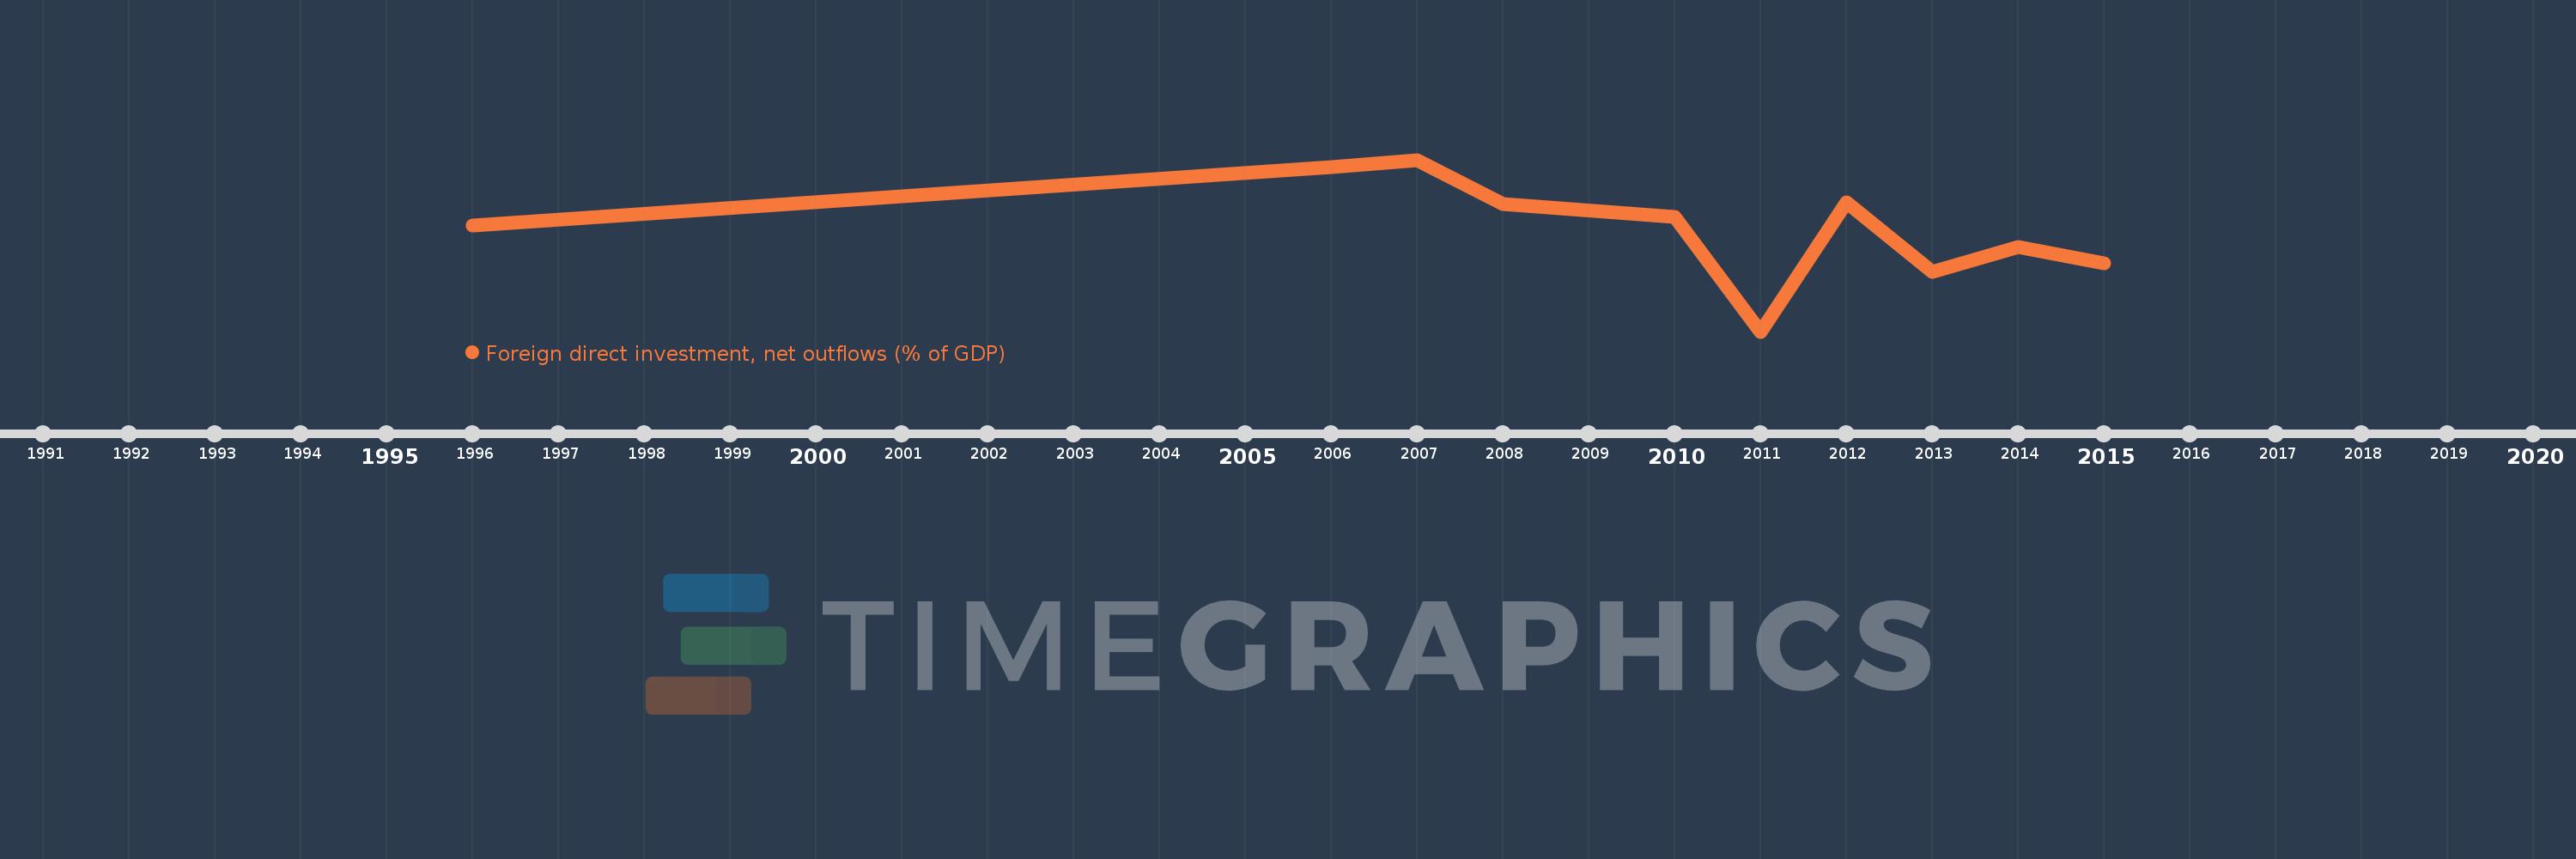
This timeline shows a graph from 1996 to 2015 of Low income. No data until 1995. Number of actual observations by date: 10.
Source name:
World Development Indicators
Source organization:
International Monetary Fund, International Financial Statistics and Balance of Payments databases, World Bank, International Debt Statistics, and World Bank and OECD GDP estimates.
Categories, topics:
Economy & Growth, Financial Sector
Last updated:
apr 23, 2017
Indicators value changes by year
Meaning:
-0.052
Minimum:
-0.987
jan 1, 2011
Maximum:
0.578
jan 1, 2007
At the date of observation
Value
Absolute change
Change from the previous value
jan 1, 1996
-0.024
-0.024
0.0%
jan 1, 2006
0.513
+0.536
-2.26K%
jan 1, 2007
0.578
+0.066
12.8%
jan 1, 2008
0.175
-0.403
-69.77%
jan 1, 2010
0.058
-0.117
-66.82%
jan 1, 2011
-0.987
-1.045
-1.8K%
jan 1, 2012
0.194
+1.181
-119.68%
jan 1, 2013
-0.444
-0.639
-328.71%
jan 1, 2014
-0.216
+0.229
-51.44%
jan 1, 2015
-0.367
-0.151
70.19%
Ranking of countries by current statistics by years