33
/
AIzaSyAYiBZKx7MnpbEhh9jyipgxe19OcubqV5w
August 1, 2025
126161
El Salvador
SLV
true
2
1
Foreign direct investment, net outflows (% of GDP)
2016,2015,2014,2013,2012,2011,2010,2009,2008,2007,2006,2005,2004,2003,2002,2001,2000,1997
Download
Global statistics library →El Salvador →

Foreign direct investment, net outflows (% of GDP)

This statistics in other country:

AfghanistanAlbaniaAlgeriaAngolaAntigua and BarbudaArab WorldArgentinaArmeniaArubaAustraliaAustriaAzerbaijanBahamas, TheBahrainBangladeshBarbadosBelarusBelgiumBelizeBeninBermudaBoliviaBosnia and HerzegovinaBotswanaBrazilBrunei DarussalamBulgariaBurkina FasoBurundiCabo VerdeCambodiaCameroonCanadaCaribbean small statesCayman IslandsCentral African RepublicCentral Europe and the BalticsChadChileChinaColombiaComorosCongo, Dem. Rep.Congo, Rep.Costa RicaCote d'IvoireCroatiaCyprusCzech RepublicDenmarkDominicaDominican RepublicEarly-demographic dividendEast Asia & PacificEast Asia & Pacific (excluding high income)East Asia & Pacific (IDA & IBRD countries)EcuadorEgypt, Arab Rep.El SalvadorEquatorial GuineaEritreaEstoniaEuro areaEurope & Central AsiaEurope & Central Asia (excluding high income)Europe & Central Asia (IDA & IBRD countries)European UnionFijiFinlandFragile and conflict affected situationsFranceFrench PolynesiaGabonGambia, TheGeorgiaGermanyGhanaGreeceGrenadaGuatemalaGuineaGuinea-BissauGuyanaHaitiHeavily indebted poor countries (HIPC)High incomeHondurasHong Kong SAR, ChinaHungaryIBRD onlyIcelandIDA & IBRD totalIDA blendIDA onlyIDA totalIndiaIndonesiaIran, Islamic Rep.IraqIrelandIsraelItalyJamaicaJapanJordanKazakhstanKenyaKiribatiKorea, Rep.KosovoKuwaitKyrgyz RepublicLao PDRLate-demographic dividendLatin America & Caribbean Latin America & Caribbean (excluding high income)Latin America & the Caribbean (IDA & IBRD countries)LatviaLeast developed countries: UN classificationLebanonLesothoLiberiaLibyaLithuaniaLow & middle incomeLow incomeLower middle incomeLuxembourgMacao SAR, ChinaMacedonia, FYRMadagascarMalawiMalaysiaMaliMaltaMarshall IslandsMauritaniaMauritiusMexicoMicronesia, Fed. Sts.Middle East & North AfricaMiddle East & North Africa (excluding high income)Middle East & North Africa (IDA & IBRD countries)Middle incomeMoldovaMongoliaMontenegroMoroccoMozambiqueNamibiaNauruNetherlandsNew ZealandNicaraguaNigerNigeriaNorth AmericaNorwayOECD membersOmanOther small statesPacific island small statesPakistanPalauPanamaPapua New GuineaParaguayPeruPhilippinesPolandPortugalPost-demographic dividendPre-demographic dividendQatarRomaniaRussian FederationRwandaSamoaSao Tome and PrincipeSaudi ArabiaSenegalSerbiaSeychellesSierra LeoneSingaporeSlovak RepublicSloveniaSmall statesSolomon IslandsSouth AfricaSouth AsiaSouth Asia (IDA & IBRD)SpainSri LankaSt. Kitts and NevisSt. LuciaSt. Vincent and the GrenadinesSub-Saharan Africa Sub-Saharan Africa (excluding high income)Sub-Saharan Africa (IDA & IBRD countries)SurinameSwazilandSwedenSwitzerlandSyrian Arab RepublicTajikistanTanzaniaThailandTimor-LesteTogoTongaTrinidad and TobagoTunisiaTurkeyUgandaUkraineUnited Arab EmiratesUnited KingdomUnited StatesUpper middle incomeUruguayVanuatuVenezuela, RBVietnamWest Bank and GazaWorldYemen, Rep.ZambiaZimbabwe

Timeline:

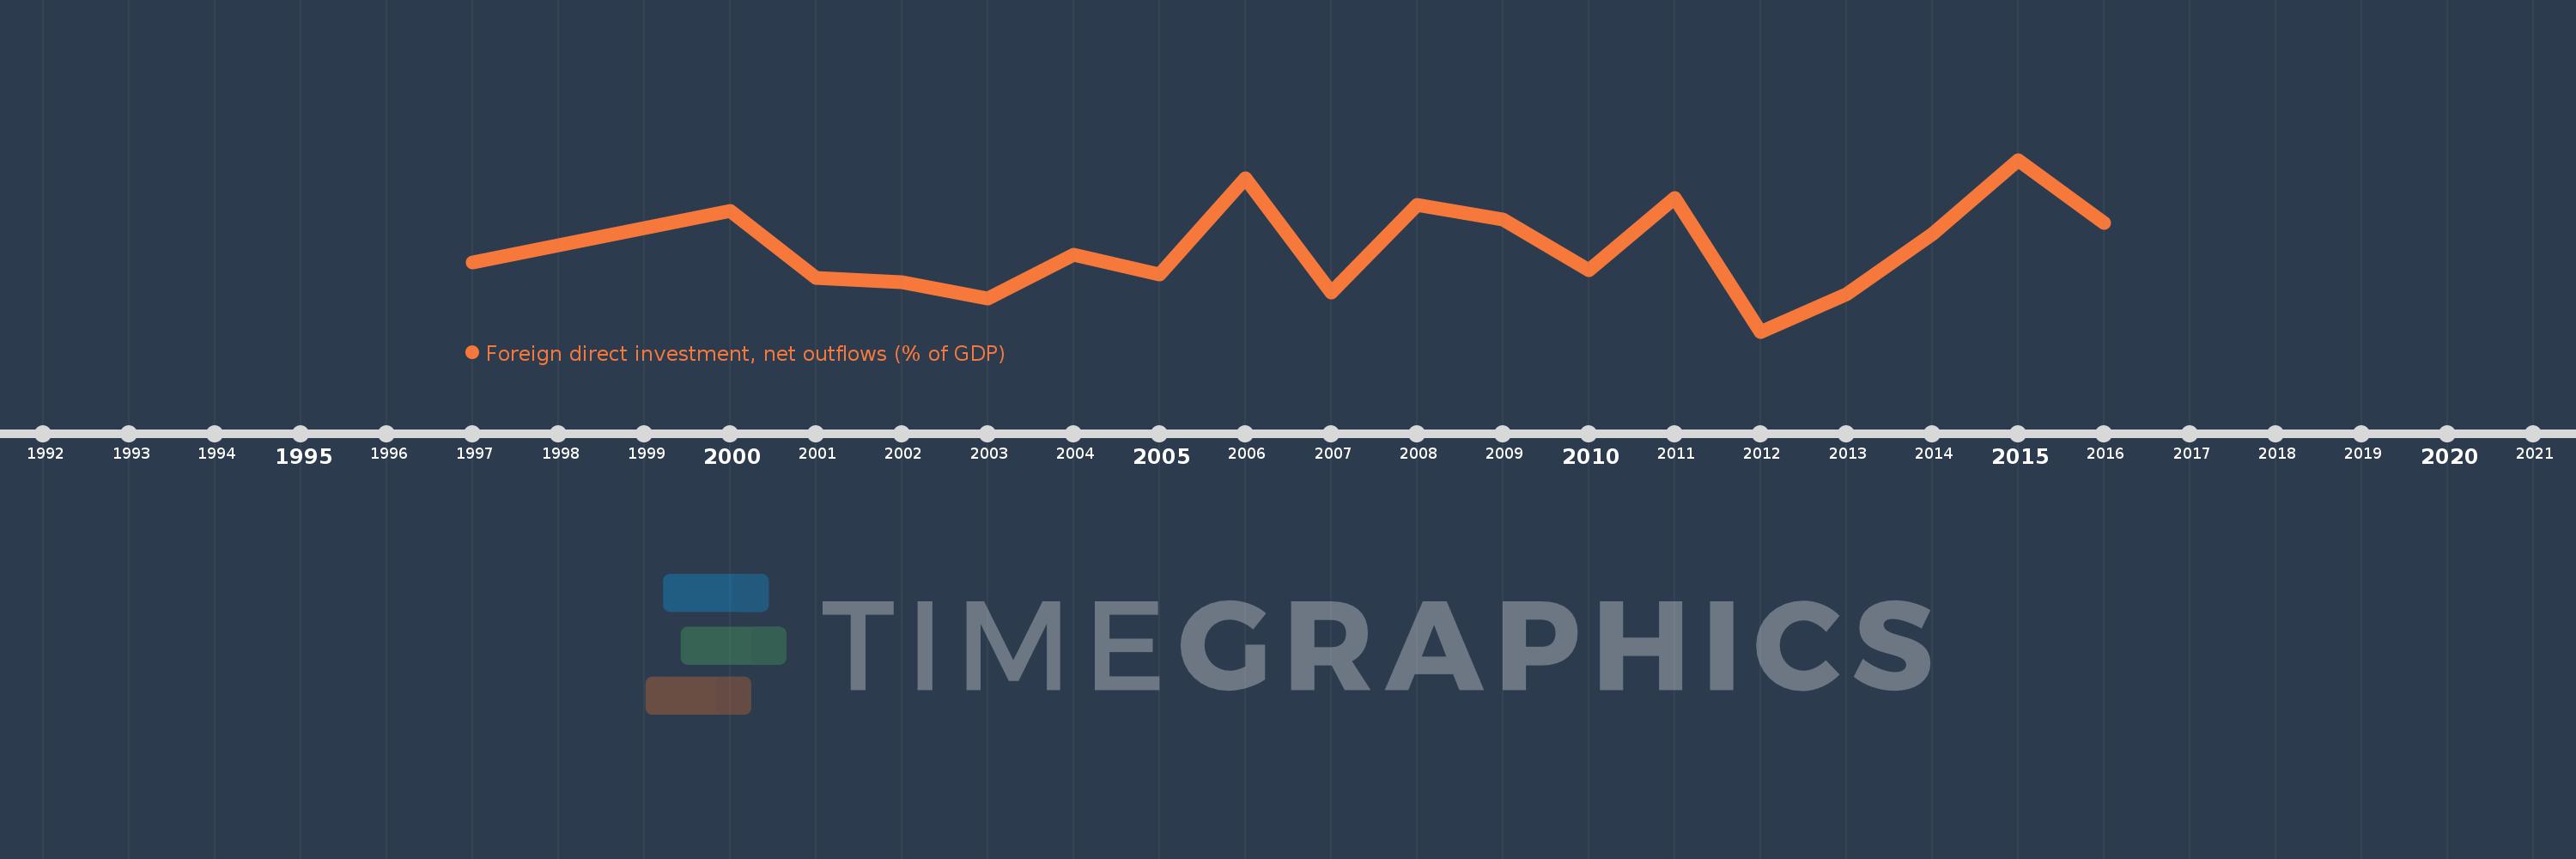
This timeline shows a graph from 1997 to 2016 of El Salvador. No data until 1996. Number of actual observations by date: 18.

Source name:

World Development Indicators

Source organization:

International Monetary Fund, International Financial Statistics and Balance of Payments databases, World Bank, International Debt Statistics, and World Bank and OECD GDP estimates.

Categories, topics:

Economy & Growth, Financial Sector

Last updated:

apr 23, 2017

Indicators value changes by year

Meaning:
0.17
Minimum:
-0.415
jan 1, 2012
Maximum:
0.791
jan 1, 2015
At the date of observation
Value
Absolute change
Change from the previous value
jan 1, 1997
0.07
+0.07
0.0%
jan 1, 2000
0.432
+0.362
518.74%
jan 1, 2001
-0.038
-0.47
-108.82%
jan 1, 2002
-0.07
-0.032
84.47%
jan 1, 2003
-0.18
-0.109
155.8%
jan 1, 2004
0.124
+0.303
-168.81%
jan 1, 2005
-0.017
-0.141
-114.08%
jan 1, 2006
0.66
+0.678
-3.89K%
jan 1, 2007
-0.142
-0.802
-121.47%
jan 1, 2008
0.474
+0.615
-433.99%
jan 1, 2009
0.371
-0.103
-21.73%
jan 1, 2010
0.014
-0.356
-96.13%
jan 1, 2011
0.525
+0.51
3.56K%
jan 1, 2012
-0.415
-0.939
-179.0%
jan 1, 2013
-0.151
+0.264
-63.64%
jan 1, 2014
0.271
+0.422
-280.02%
jan 1, 2015
0.791
+0.52
191.53%
jan 1, 2016
0.347
-0.444
-56.14%

Ranking of countries by current statistics by years