33
/
AIzaSyAYiBZKx7MnpbEhh9jyipgxe19OcubqV5w
May 1, 2025
193011
Mauritania
MRT
true
2
1
Foreign direct investment, net outflows (% of GDP)
2015,2014,2013,2012,2011,2010,2009,2008,2007,2006,2005,2004,2003,1999,1998,1997,1996,1995,1994,1993,1989,1988,1987
Download
Global statistics library →Mauritania →

Foreign direct investment, net outflows (% of GDP)

This statistics in other country:

AfghanistanAlbaniaAlgeriaAngolaAntigua and BarbudaArab WorldArgentinaArmeniaArubaAustraliaAustriaAzerbaijanBahamas, TheBahrainBangladeshBarbadosBelarusBelgiumBelizeBeninBermudaBoliviaBosnia and HerzegovinaBotswanaBrazilBrunei DarussalamBulgariaBurkina FasoBurundiCabo VerdeCambodiaCameroonCanadaCaribbean small statesCayman IslandsCentral African RepublicCentral Europe and the BalticsChadChileChinaColombiaComorosCongo, Dem. Rep.Congo, Rep.Costa RicaCote d'IvoireCroatiaCyprusCzech RepublicDenmarkDominicaDominican RepublicEarly-demographic dividendEast Asia & PacificEast Asia & Pacific (excluding high income)East Asia & Pacific (IDA & IBRD countries)EcuadorEgypt, Arab Rep.El SalvadorEquatorial GuineaEritreaEstoniaEuro areaEurope & Central AsiaEurope & Central Asia (excluding high income)Europe & Central Asia (IDA & IBRD countries)European UnionFijiFinlandFragile and conflict affected situationsFranceFrench PolynesiaGabonGambia, TheGeorgiaGermanyGhanaGreeceGrenadaGuatemalaGuineaGuinea-BissauGuyanaHaitiHeavily indebted poor countries (HIPC)High incomeHondurasHong Kong SAR, ChinaHungaryIBRD onlyIcelandIDA & IBRD totalIDA blendIDA onlyIDA totalIndiaIndonesiaIran, Islamic Rep.IraqIrelandIsraelItalyJamaicaJapanJordanKazakhstanKenyaKiribatiKorea, Rep.KosovoKuwaitKyrgyz RepublicLao PDRLate-demographic dividendLatin America & Caribbean Latin America & Caribbean (excluding high income)Latin America & the Caribbean (IDA & IBRD countries)LatviaLeast developed countries: UN classificationLebanonLesothoLiberiaLibyaLithuaniaLow & middle incomeLow incomeLower middle incomeLuxembourgMacao SAR, ChinaMacedonia, FYRMadagascarMalawiMalaysiaMaliMaltaMarshall IslandsMauritaniaMauritiusMexicoMicronesia, Fed. Sts.Middle East & North AfricaMiddle East & North Africa (excluding high income)Middle East & North Africa (IDA & IBRD countries)Middle incomeMoldovaMongoliaMontenegroMoroccoMozambiqueNamibiaNauruNetherlandsNew ZealandNicaraguaNigerNigeriaNorth AmericaNorwayOECD membersOmanOther small statesPacific island small statesPakistanPalauPanamaPapua New GuineaParaguayPeruPhilippinesPolandPortugalPost-demographic dividendPre-demographic dividendQatarRomaniaRussian FederationRwandaSamoaSao Tome and PrincipeSaudi ArabiaSenegalSerbiaSeychellesSierra LeoneSingaporeSlovak RepublicSloveniaSmall statesSolomon IslandsSouth AfricaSouth AsiaSouth Asia (IDA & IBRD)SpainSri LankaSt. Kitts and NevisSt. LuciaSt. Vincent and the GrenadinesSub-Saharan Africa Sub-Saharan Africa (excluding high income)Sub-Saharan Africa (IDA & IBRD countries)SurinameSwazilandSwedenSwitzerlandSyrian Arab RepublicTajikistanTanzaniaThailandTimor-LesteTogoTongaTrinidad and TobagoTunisiaTurkeyUgandaUkraineUnited Arab EmiratesUnited KingdomUnited StatesUpper middle incomeUruguayVanuatuVenezuela, RBVietnamWest Bank and GazaWorldYemen, Rep.ZambiaZimbabwe

Timeline:

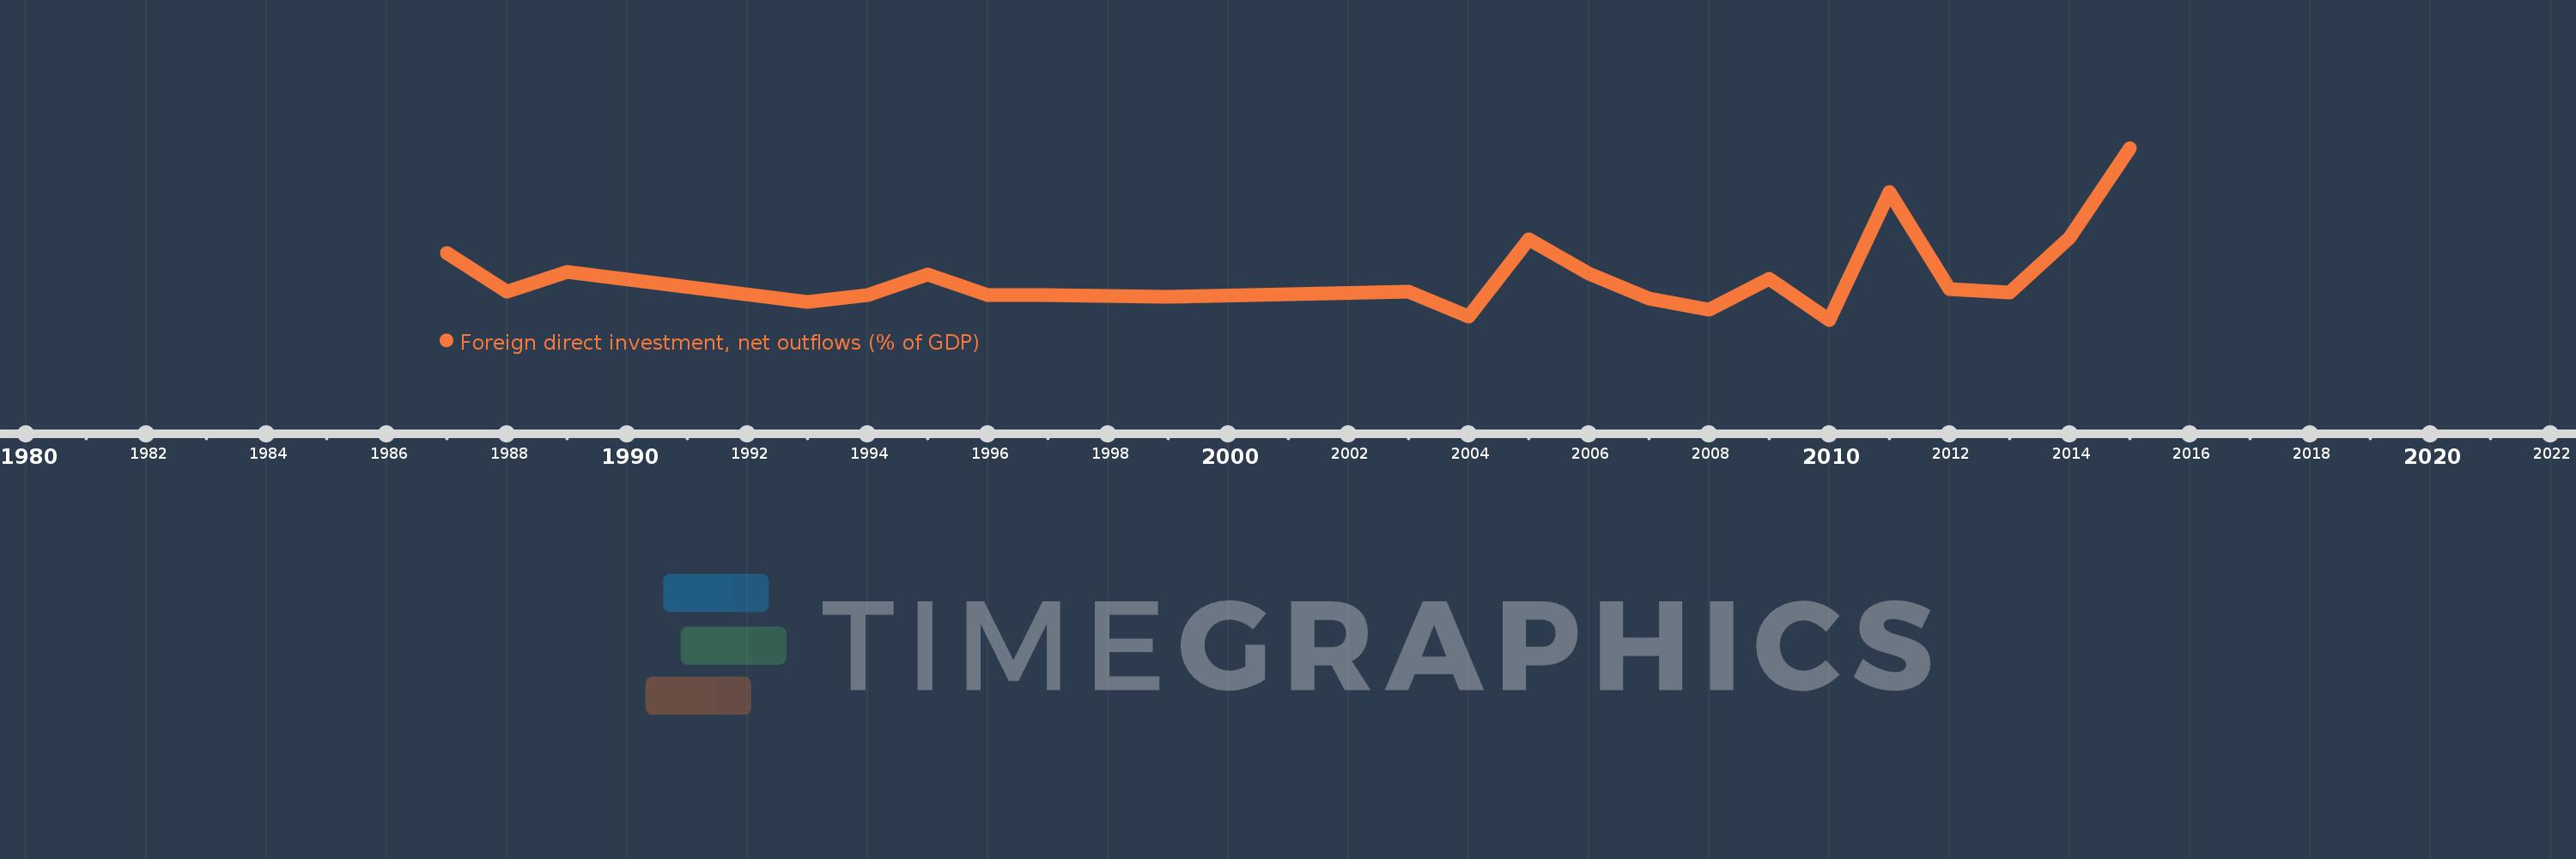
This timeline shows a graph from 1987 to 2015 of Mauritania. No data until 1986. Number of actual observations by date: 23.

Source name:

World Development Indicators

Source organization:

International Monetary Fund, International Financial Statistics and Balance of Payments databases, World Bank, International Debt Statistics, and World Bank and OECD GDP estimates.

Categories, topics:

Economy & Growth, Financial Sector

Last updated:

apr 23, 2017

Indicators value changes by year

Meaning:
0.082
Minimum:
-0.076
jan 1, 2010
Maximum:
0.552
jan 1, 2015
At the date of observation
Value
Absolute change
Change from the previous value
jan 1, 1987
0.169
+0.169
0.0%
jan 1, 1988
0.027
-0.142
-84.17%
jan 1, 1989
0.099
+0.072
267.96%
jan 1, 1993
-0.011
-0.109
-110.94%
jan 1, 1994
0.014
+0.025
-231.1%
jan 1, 1995
0.089
+0.075
529.74%
jan 1, 1996
0.014
-0.075
-84.09%
jan 1, 1997
0.014
-0.001
-4.27%
jan 1, 1998
0.012
-0.001
-9.81%
jan 1, 1999
0.007
-0.005
-44.81%
jan 1, 2003
0.028
+0.021
308.59%
jan 1, 2004
-0.064
-0.092
-332.14%
jan 1, 2005
0.219
+0.283
-441.7%
jan 1, 2006
0.093
-0.126
-57.64%
jan 1, 2007
0.002
-0.091
-97.98%
jan 1, 2008
-0.038
-0.04
-2.13K%
jan 1, 2009
0.074
+0.112
-294.96%
jan 1, 2010
-0.076
-0.15
-202.44%
jan 1, 2011
0.39
+0.466
-614.4%
jan 1, 2012
0.035
-0.355
-91.08%
jan 1, 2013
0.023
-0.012
-35.24%
jan 1, 2014
0.226
+0.203
902.11%
jan 1, 2015
0.552
+0.326
144.2%

Ranking of countries by current statistics by years