29
/
en
AIzaSyAYiBZKx7MnpbEhh9jyipgxe19OcubqV5w
April 1, 2024
99903
Cameroon
CMR
true
2
1
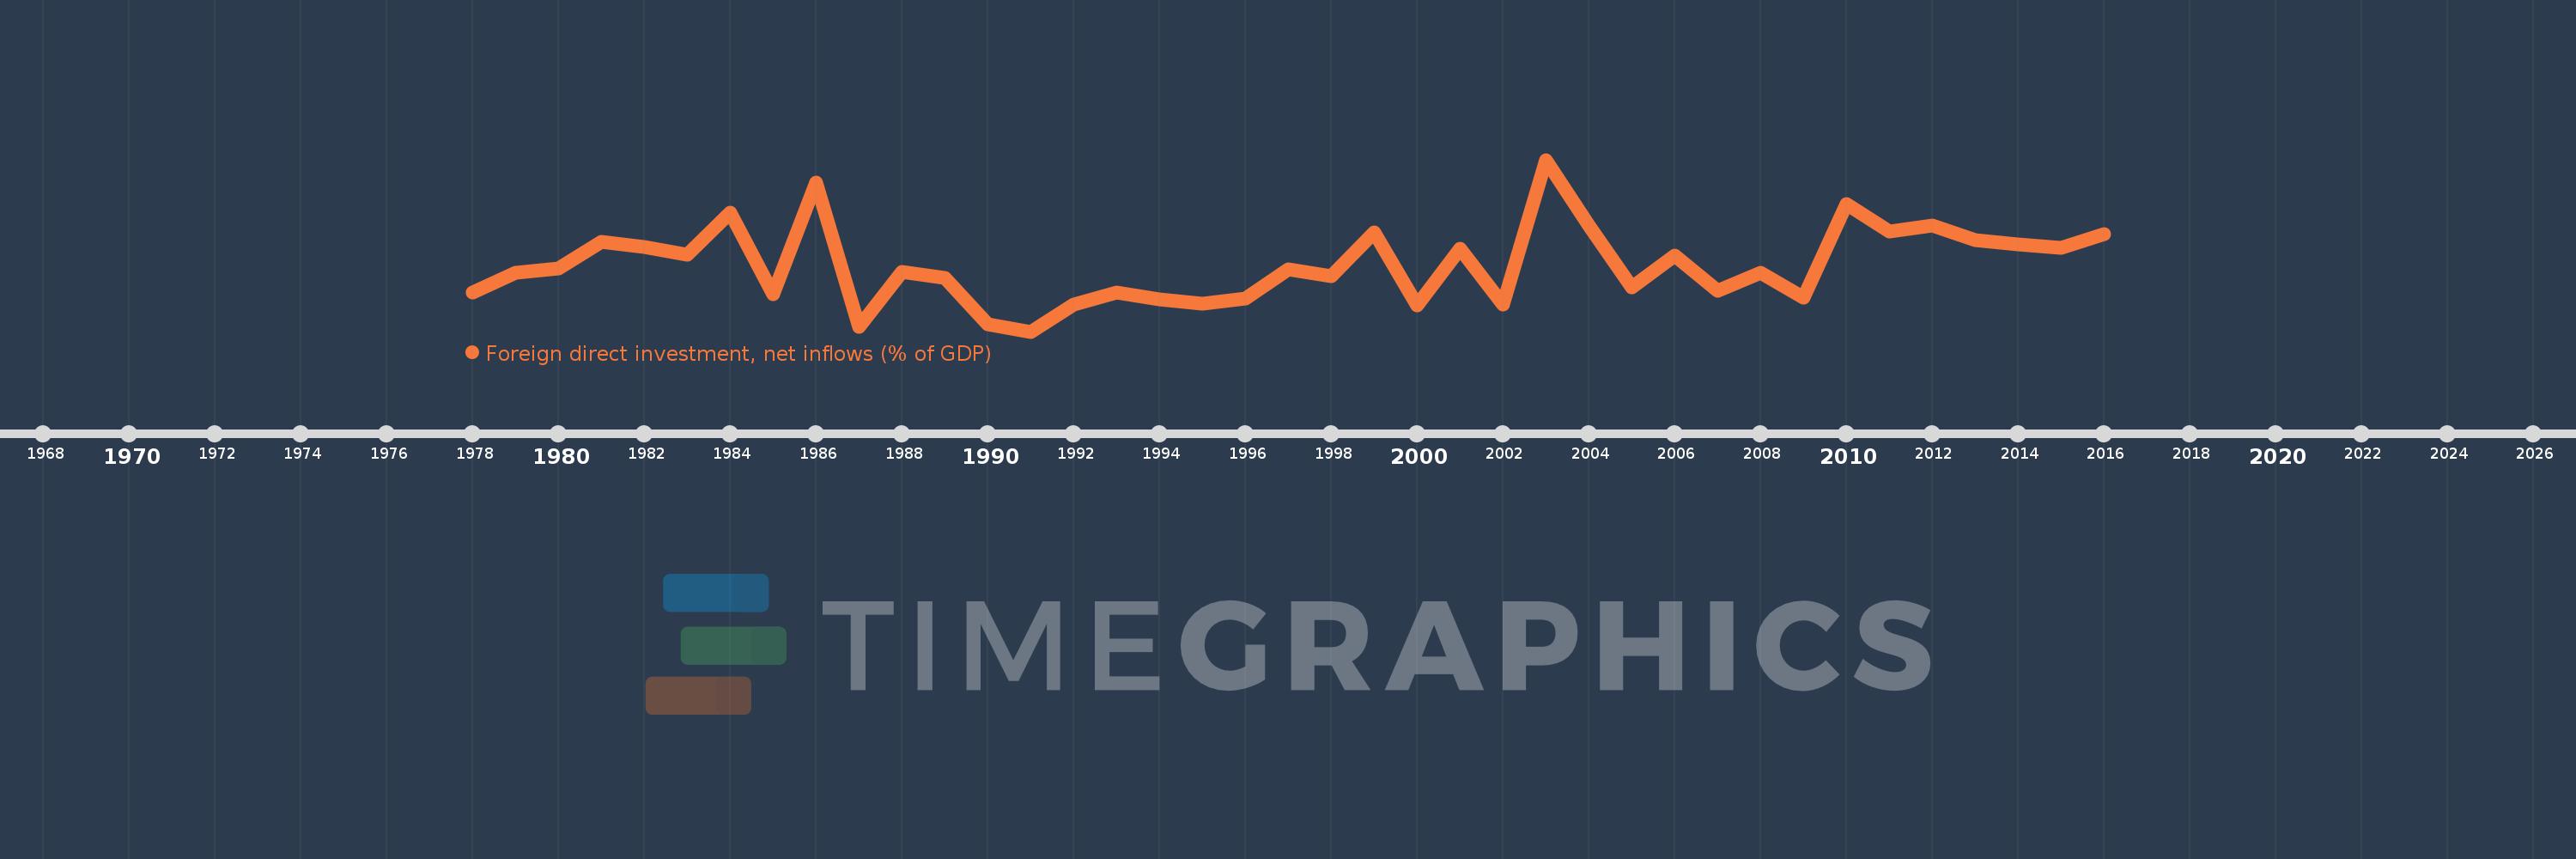
Foreign direct investment, net inflows (% of GDP)
2016,2015,2014,2013,2012,2011,2010,2009,2008,2007,2006,2005,2004,2003,2002,2001,2000,1999,1998,1997,1996,1995,1994,1993,1992,1991,1990,1989,1988,1987,1986,1985,1984,1983,1982,1981,1980,1979,1978
This statistics in other country:
AfghanistanAlbaniaAlgeriaAngolaAntigua and BarbudaArab WorldArgentinaArmeniaArubaAustraliaAustriaAzerbaijanBahamas, TheBahrainBangladeshBarbadosBelarusBelgiumBelizeBeninBermudaBhutanBoliviaBosnia and HerzegovinaBotswanaBrazilBrunei DarussalamBulgariaBurkina FasoBurundiCabo VerdeCambodiaCameroonCanadaCaribbean small statesCayman IslandsCentral African RepublicCentral Europe and the BalticsChadChileChinaColombiaComorosCongo, Dem. Rep.Congo, Rep.Costa RicaCote d'IvoireCroatiaCyprusCzech RepublicDenmarkDjiboutiDominicaDominican RepublicEarly-demographic dividendEast Asia & PacificEast Asia & Pacific (excluding high income)East Asia & Pacific (IDA & IBRD countries)EcuadorEgypt, Arab Rep.El SalvadorEquatorial GuineaEritreaEstoniaEthiopiaEuro areaEurope & Central AsiaEurope & Central Asia (excluding high income)Europe & Central Asia (IDA & IBRD countries)European UnionFijiFinlandFragile and conflict affected situationsFranceFrench PolynesiaGabonGambia, TheGeorgiaGermanyGhanaGreeceGrenadaGuatemalaGuineaGuinea-BissauGuyanaHaitiHeavily indebted poor countries (HIPC)High incomeHondurasHong Kong SAR, ChinaHungaryIBRD onlyIcelandIDA & IBRD totalIDA blendIDA onlyIDA totalIndiaIndonesiaIran, Islamic Rep.IraqIrelandIsraelItalyJamaicaJapanJordanKazakhstanKenyaKiribatiKorea, Rep.KosovoKuwaitKyrgyz RepublicLao PDRLate-demographic dividendLatin America & Caribbean Latin America & Caribbean (excluding high income)Latin America & the Caribbean (IDA & IBRD countries)LatviaLeast developed countries: UN classificationLebanonLesothoLiberiaLibyaLithuaniaLow & middle incomeLow incomeLower middle incomeLuxembourgMacao SAR, ChinaMacedonia, FYRMadagascarMalawiMalaysiaMaldivesMaliMaltaMarshall IslandsMauritaniaMauritiusMexicoMicronesia, Fed. Sts.Middle East & North AfricaMiddle East & North Africa (excluding high income)Middle East & North Africa (IDA & IBRD countries)Middle incomeMoldovaMongoliaMontenegroMoroccoMozambiqueMyanmarNamibiaNauruNepalNetherlandsNew CaledoniaNew ZealandNicaraguaNigerNigeriaNorth AmericaNorwayOECD membersOmanOther small statesPacific island small statesPakistanPalauPanamaPapua New GuineaParaguayPeruPhilippinesPolandPortugalPost-demographic dividendPre-demographic dividendQatarRomaniaRussian FederationRwandaSamoaSao Tome and PrincipeSaudi ArabiaSenegalSerbiaSeychellesSierra LeoneSingaporeSlovak RepublicSloveniaSmall statesSolomon IslandsSomaliaSouth AfricaSouth AsiaSouth Asia (IDA & IBRD)South SudanSpainSri LankaSt. Kitts and NevisSt. LuciaSt. Vincent and the GrenadinesSub-Saharan Africa Sub-Saharan Africa (excluding high income)Sub-Saharan Africa (IDA & IBRD countries)SudanSurinameSwazilandSwedenSwitzerlandSyrian Arab RepublicTajikistanTanzaniaThailandTimor-LesteTogoTongaTrinidad and TobagoTunisiaTurkeyTurkmenistanTuvaluUgandaUkraineUnited Arab EmiratesUnited KingdomUnited StatesUpper middle incomeUruguayUzbekistanVanuatuVenezuela, RBVietnamWest Bank and GazaWorldYemen, Rep.ZambiaZimbabwe Timeline:
This timeline shows a graph from 1978 to 2016 of Cameroon. No data until 1977. Number of actual observations by date: 39.
Source name:
World Development Indicators
Source organization:
International Monetary Fund, International Financial Statistics and Balance of Payments databases, World Bank, International Debt Statistics, and World Bank and OECD GDP estimates.
Categories, topics:
Economy & Growth, Financial Sector, Climate Change
Last updated:
apr 23, 2017
Indicators value changes by year
Minimum:
-1.012
jan 1, 1991
At the date of observation
Value
Absolute change
Change from previous value
jan 1, 1978
0.259
+0.259
0.0%
jan 1, 1979
0.919
+0.661
255.35%
jan 1, 1980
1.069
+0.149
16.22%
jan 1, 1981
1.926
+0.857
80.24%
jan 1, 1982
1.773
-0.153
-7.95%
jan 1, 1983
1.522
-0.251
-14.17%
jan 1, 1984
2.897
+1.375
90.34%
jan 1, 1985
0.226
-2.67
-92.18%
jan 1, 1986
3.881
+3.655
1.61K%
jan 1, 1987
-0.854
-4.735
-122.0%
jan 1, 1988
0.942
+1.796
-210.34%
jan 1, 1989
0.739
-0.203
-21.54%
jan 1, 1990
-0.77
-1.509
-204.1%
jan 1, 1991
-1.012
-0.242
31.47%
jan 1, 1992
-0.117
+0.895
-88.48%
jan 1, 1993
0.256
+0.373
-319.78%
jan 1, 1994
0.038
-0.218
-85.23%
jan 1, 1995
-0.098
-0.136
-358.11%
jan 1, 1996
0.084
+0.181
-185.49%
jan 1, 1997
1.041
+0.958
1.15K%
jan 1, 1998
0.796
-0.245
-23.53%
jan 1, 1999
2.234
+1.438
180.61%
jan 1, 2000
-0.148
-2.382
-106.61%
jan 1, 2001
1.715
+1.863
-1.26K%
jan 1, 2002
-0.121
-1.836
-107.06%
jan 1, 2003
4.622
+4.743
-3.92K%
jan 1, 2004
2.453
-2.169
-46.93%
jan 1, 2005
0.43
-2.023
-82.46%
jan 1, 2006
1.468
+1.038
241.24%
jan 1, 2007
0.329
-1.139
-77.59%
jan 1, 2008
0.927
+0.598
181.64%
jan 1, 2009
0.09
-0.837
-90.32%
jan 1, 2010
3.179
+3.089
3.45K%
jan 1, 2011
2.268
-0.911
-28.66%
jan 1, 2012
2.454
+0.186
8.2%
jan 1, 2013
1.992
-0.462
-18.81%
jan 1, 2014
1.851
-0.141
-7.1%
jan 1, 2015
1.728
-0.123
-6.62%
jan 1, 2016
2.182
+0.454
26.27%
Ranking of countries by current statistics by years


Comments: