29
/
en
AIzaSyAYiBZKx7MnpbEhh9jyipgxe19OcubqV5w
April 1, 2024
107228
Colombia
COL
true
2
1
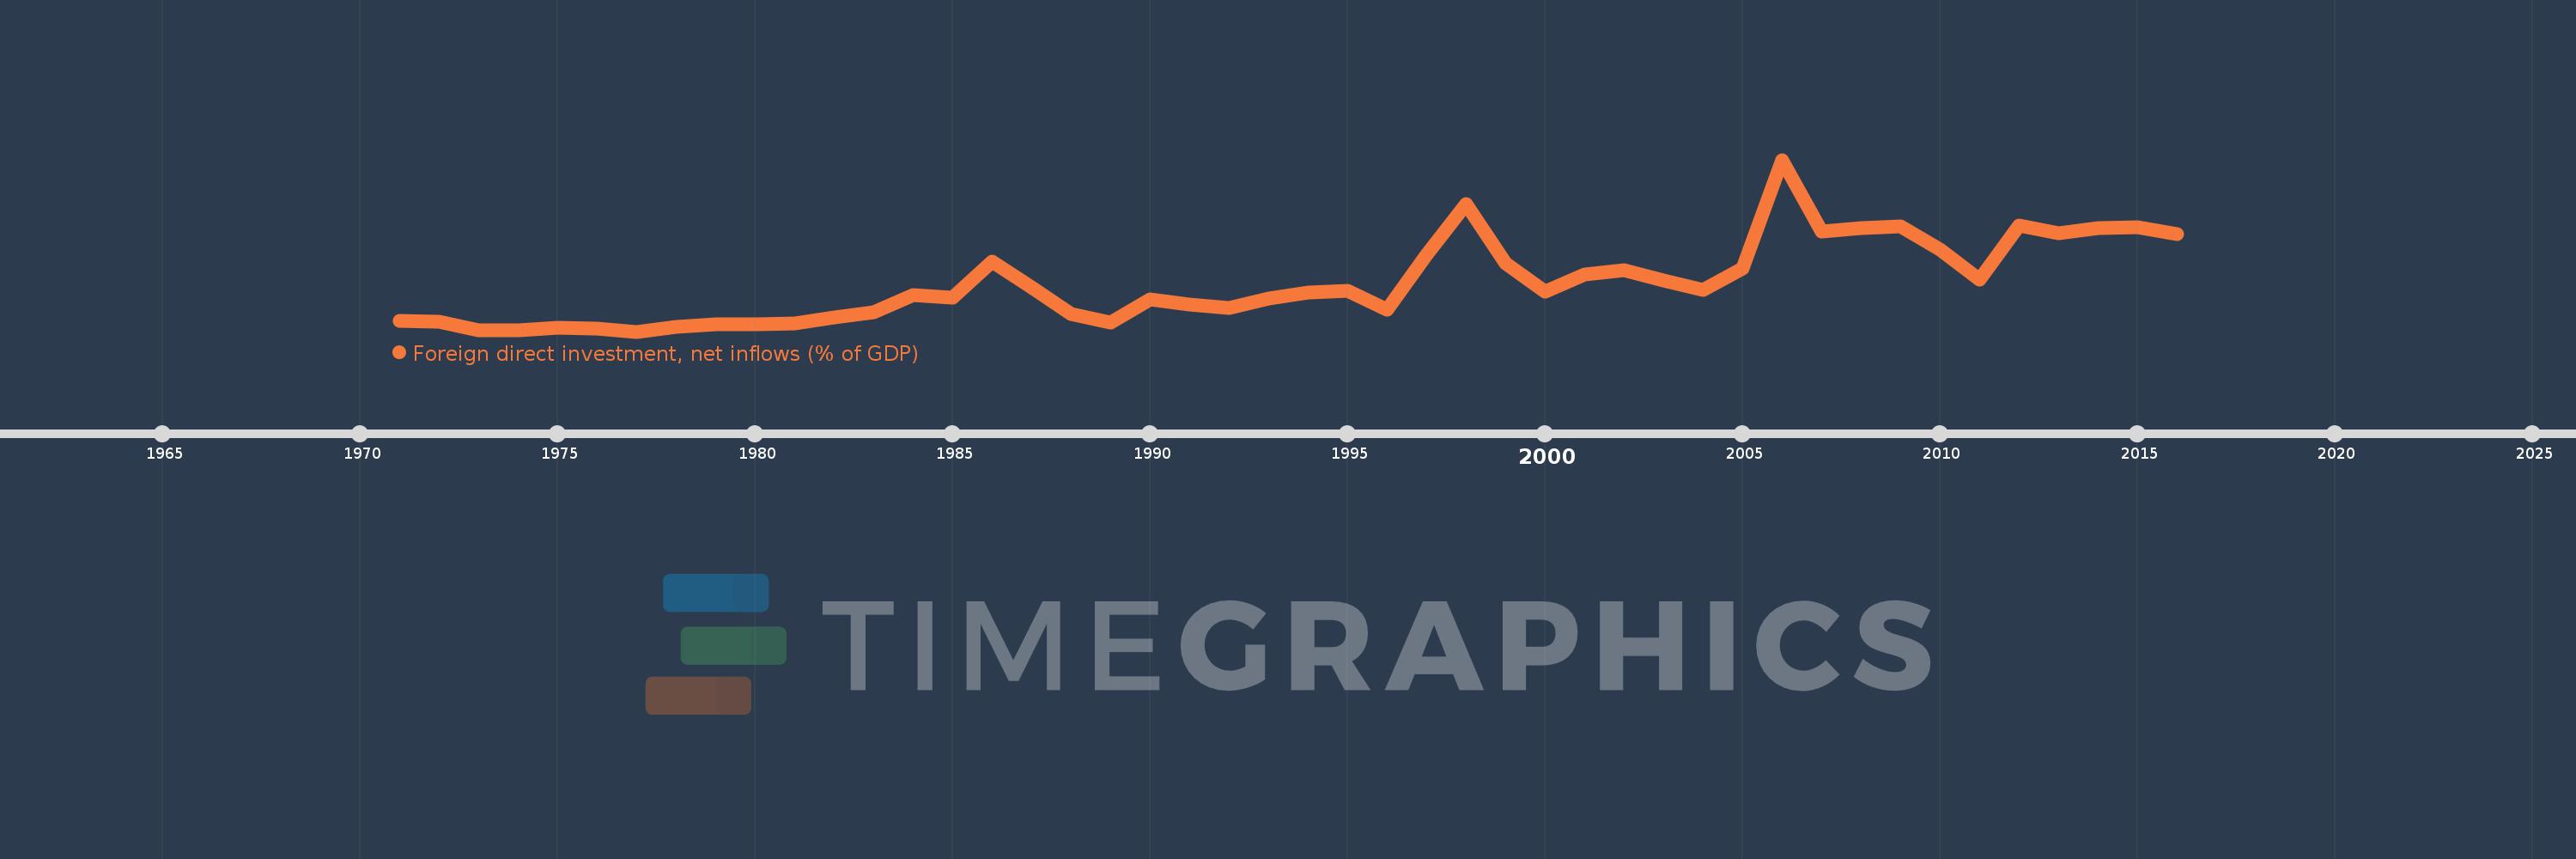
Foreign direct investment, net inflows (% of GDP)
2016,2015,2014,2013,2012,2011,2010,2009,2008,2007,2006,2005,2004,2003,2002,2001,2000,1999,1998,1997,1996,1995,1994,1993,1992,1991,1990,1989,1988,1987,1986,1985,1984,1983,1982,1981,1980,1979,1978,1977,1976,1975,1974,1973,1972,1971
This statistics in other country:
AfghanistanAlbaniaAlgeriaAngolaAntigua and BarbudaArab WorldArgentinaArmeniaArubaAustraliaAustriaAzerbaijanBahamas, TheBahrainBangladeshBarbadosBelarusBelgiumBelizeBeninBermudaBhutanBoliviaBosnia and HerzegovinaBotswanaBrazilBrunei DarussalamBulgariaBurkina FasoBurundiCabo VerdeCambodiaCameroonCanadaCaribbean small statesCayman IslandsCentral African RepublicCentral Europe and the BalticsChadChileChinaColombiaComorosCongo, Dem. Rep.Congo, Rep.Costa RicaCote d'IvoireCroatiaCyprusCzech RepublicDenmarkDjiboutiDominicaDominican RepublicEarly-demographic dividendEast Asia & PacificEast Asia & Pacific (excluding high income)East Asia & Pacific (IDA & IBRD countries)EcuadorEgypt, Arab Rep.El SalvadorEquatorial GuineaEritreaEstoniaEthiopiaEuro areaEurope & Central AsiaEurope & Central Asia (excluding high income)Europe & Central Asia (IDA & IBRD countries)European UnionFijiFinlandFragile and conflict affected situationsFranceFrench PolynesiaGabonGambia, TheGeorgiaGermanyGhanaGreeceGrenadaGuatemalaGuineaGuinea-BissauGuyanaHaitiHeavily indebted poor countries (HIPC)High incomeHondurasHong Kong SAR, ChinaHungaryIBRD onlyIcelandIDA & IBRD totalIDA blendIDA onlyIDA totalIndiaIndonesiaIran, Islamic Rep.IraqIrelandIsraelItalyJamaicaJapanJordanKazakhstanKenyaKiribatiKorea, Rep.KosovoKuwaitKyrgyz RepublicLao PDRLate-demographic dividendLatin America & Caribbean Latin America & Caribbean (excluding high income)Latin America & the Caribbean (IDA & IBRD countries)LatviaLeast developed countries: UN classificationLebanonLesothoLiberiaLibyaLithuaniaLow & middle incomeLow incomeLower middle incomeLuxembourgMacao SAR, ChinaMacedonia, FYRMadagascarMalawiMalaysiaMaldivesMaliMaltaMarshall IslandsMauritaniaMauritiusMexicoMicronesia, Fed. Sts.Middle East & North AfricaMiddle East & North Africa (excluding high income)Middle East & North Africa (IDA & IBRD countries)Middle incomeMoldovaMongoliaMontenegroMoroccoMozambiqueMyanmarNamibiaNauruNepalNetherlandsNew CaledoniaNew ZealandNicaraguaNigerNigeriaNorth AmericaNorwayOECD membersOmanOther small statesPacific island small statesPakistanPalauPanamaPapua New GuineaParaguayPeruPhilippinesPolandPortugalPost-demographic dividendPre-demographic dividendQatarRomaniaRussian FederationRwandaSamoaSao Tome and PrincipeSaudi ArabiaSenegalSerbiaSeychellesSierra LeoneSingaporeSlovak RepublicSloveniaSmall statesSolomon IslandsSomaliaSouth AfricaSouth AsiaSouth Asia (IDA & IBRD)South SudanSpainSri LankaSt. Kitts and NevisSt. LuciaSt. Vincent and the GrenadinesSub-Saharan Africa Sub-Saharan Africa (excluding high income)Sub-Saharan Africa (IDA & IBRD countries)SudanSurinameSwazilandSwedenSwitzerlandSyrian Arab RepublicTajikistanTanzaniaThailandTimor-LesteTogoTongaTrinidad and TobagoTunisiaTurkeyTurkmenistanTuvaluUgandaUkraineUnited Arab EmiratesUnited KingdomUnited StatesUpper middle incomeUruguayUzbekistanVanuatuVenezuela, RBVietnamWest Bank and GazaWorldYemen, Rep.ZambiaZimbabwe Timeline:
This timeline shows a graph from 1971 to 2016 of Colombia. No data until 1970. Number of actual observations by date: 46.
Source name:
World Development Indicators
Source organization:
International Monetary Fund, International Financial Statistics and Balance of Payments databases, World Bank, International Debt Statistics, and World Bank and OECD GDP estimates.
Categories, topics:
Economy & Growth, Financial Sector, Climate Change
Last updated:
apr 23, 2017
Indicators value changes by year
At the date of observation
Value
Absolute change
Change from previous value
jan 1, 1971
0.597
+0.597
0.0%
jan 1, 1972
0.551
-0.046
-7.68%
jan 1, 1973
0.213
-0.339
-61.4%
jan 1, 1974
0.231
+0.018
8.59%
jan 1, 1975
0.331
+0.099
43.02%
jan 1, 1976
0.283
-0.048
-14.39%
jan 1, 1977
0.163
-0.12
-42.42%
jan 1, 1978
0.334
+0.171
104.86%
jan 1, 1979
0.46
+0.126
37.78%
jan 1, 1980
0.455
-0.005
-1.18%
jan 1, 1981
0.47
+0.016
3.5%
jan 1, 1982
0.728
+0.258
54.8%
jan 1, 1983
0.939
+0.211
28.97%
jan 1, 1984
1.596
+0.656
69.89%
jan 1, 1985
1.527
-0.069
-4.32%
jan 1, 1986
2.932
+1.405
92.03%
jan 1, 1987
1.929
-1.003
-34.21%
jan 1, 1988
0.877
-1.052
-54.53%
jan 1, 1989
0.518
-0.359
-40.97%
jan 1, 1990
1.457
+0.939
181.39%
jan 1, 1991
1.241
-0.215
-14.78%
jan 1, 1992
1.108
-0.134
-10.76%
jan 1, 1993
1.479
+0.371
33.47%
jan 1, 1994
1.719
+0.24
16.23%
jan 1, 1995
1.77
+0.052
3.01%
jan 1, 1996
1.047
-0.724
-40.87%
jan 1, 1997
3.203
+2.156
205.94%
jan 1, 1998
5.215
+2.012
62.83%
jan 1, 1999
2.874
-2.341
-44.9%
jan 1, 2000
1.75
-1.124
-39.11%
jan 1, 2001
2.439
+0.69
39.42%
jan 1, 2002
2.588
+0.149
6.12%
jan 1, 2003
2.179
-0.41
-15.83%
jan 1, 2004
1.817
-0.362
-16.6%
jan 1, 2005
2.661
+0.844
46.46%
jan 1, 2006
6.983
+4.322
162.41%
jan 1, 2007
4.152
-2.832
-40.55%
jan 1, 2008
4.284
+0.132
3.18%
jan 1, 2009
4.33
+0.046
1.08%
jan 1, 2010
3.436
-0.894
-20.64%
jan 1, 2011
2.24
-1.196
-34.8%
jan 1, 2012
4.367
+2.127
94.94%
jan 1, 2013
4.068
-0.299
-6.84%
jan 1, 2014
4.263
+0.195
4.79%
jan 1, 2015
4.314
+0.051
1.19%
jan 1, 2016
4.017
-0.297
-6.89%
Ranking of countries by current statistics by years


Comments: