29
/
en
AIzaSyAYiBZKx7MnpbEhh9jyipgxe19OcubqV5w
April 1, 2024
62583
World
WLD
false
2
1
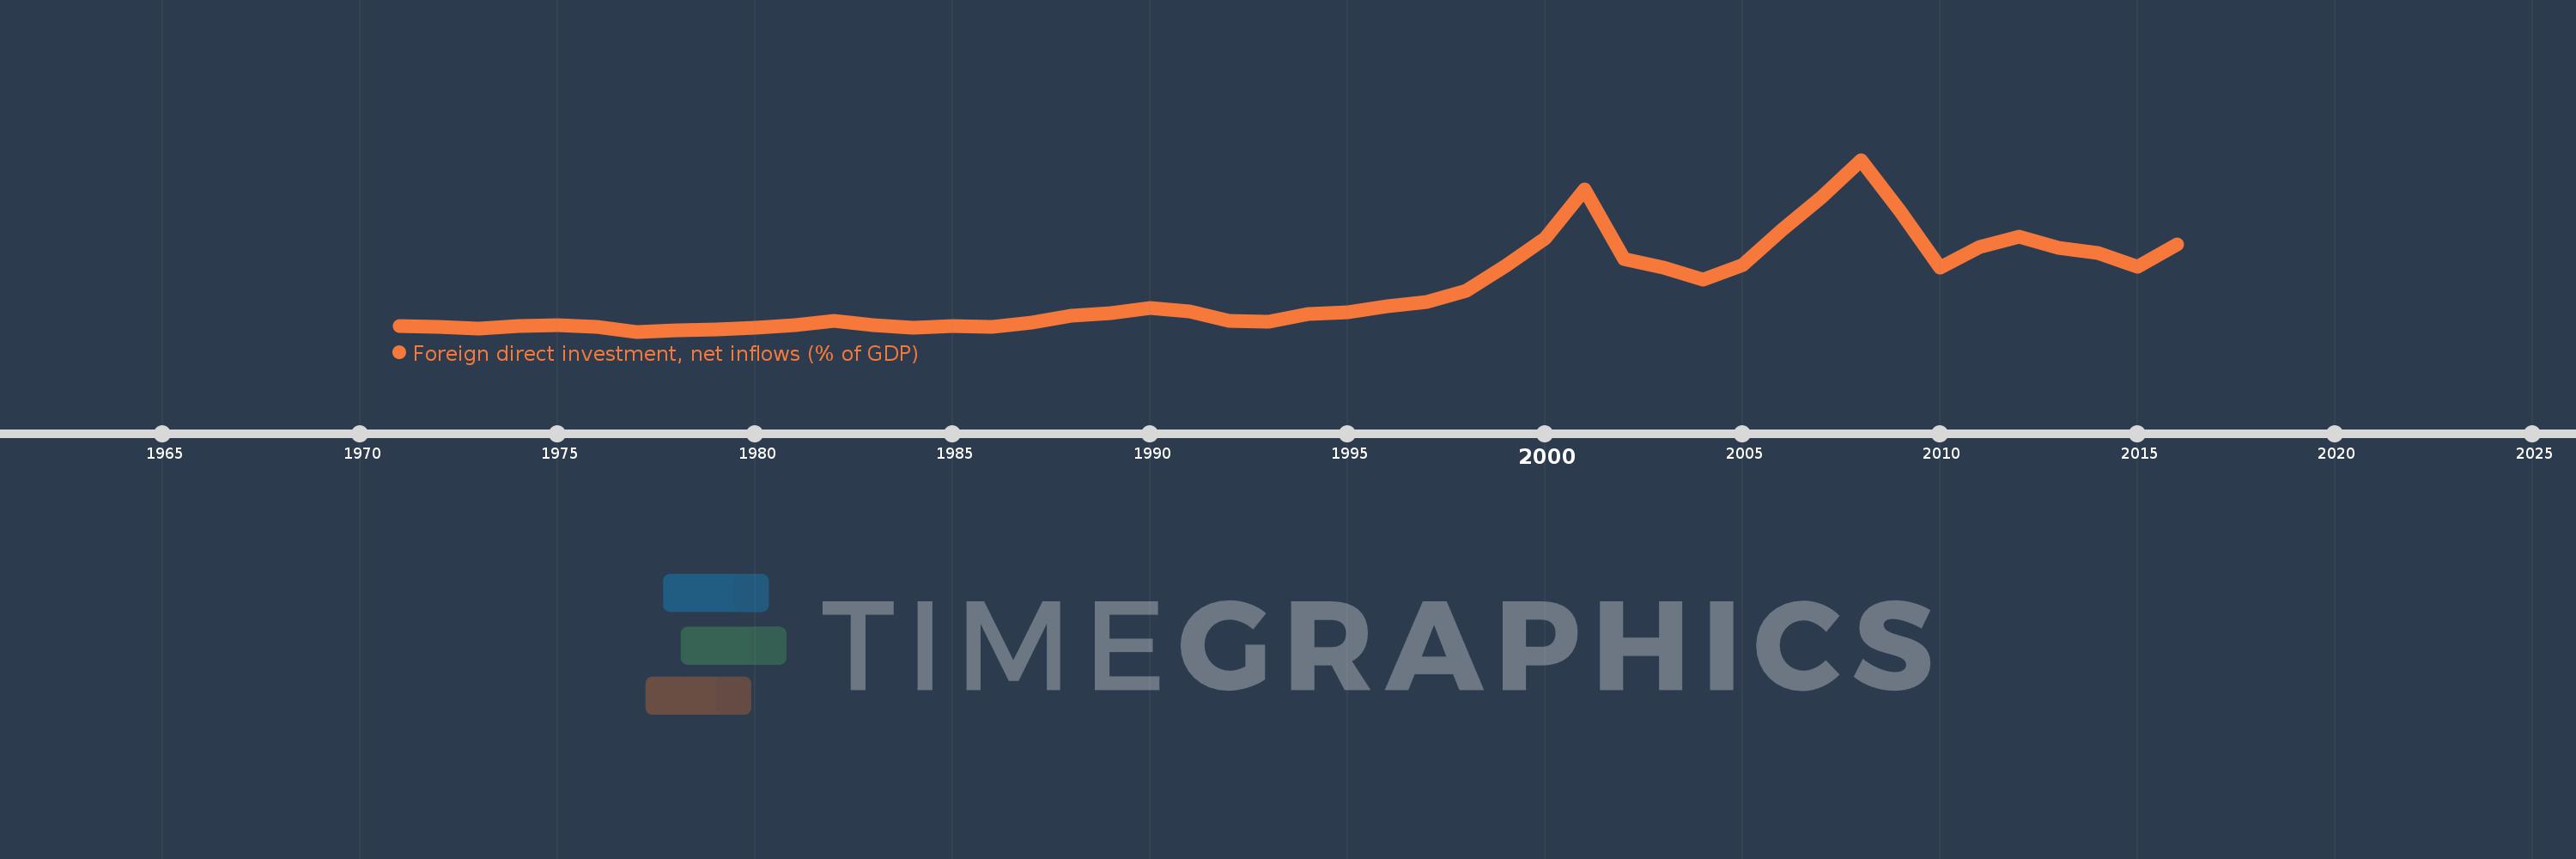
Foreign direct investment, net inflows (% of GDP)
2016,2015,2014,2013,2012,2011,2010,2009,2008,2007,2006,2005,2004,2003,2002,2001,2000,1999,1998,1997,1996,1995,1994,1993,1992,1991,1990,1989,1988,1987,1986,1985,1984,1983,1982,1981,1980,1979,1978,1977,1976,1975,1974,1973,1972,1971
This statistics in other country:
AfghanistanAlbaniaAlgeriaAngolaAntigua and BarbudaArab WorldArgentinaArmeniaArubaAustraliaAustriaAzerbaijanBahamas, TheBahrainBangladeshBarbadosBelarusBelgiumBelizeBeninBermudaBhutanBoliviaBosnia and HerzegovinaBotswanaBrazilBrunei DarussalamBulgariaBurkina FasoBurundiCabo VerdeCambodiaCameroonCanadaCaribbean small statesCayman IslandsCentral African RepublicCentral Europe and the BalticsChadChileChinaColombiaComorosCongo, Dem. Rep.Congo, Rep.Costa RicaCote d'IvoireCroatiaCyprusCzech RepublicDenmarkDjiboutiDominicaDominican RepublicEarly-demographic dividendEast Asia & PacificEast Asia & Pacific (excluding high income)East Asia & Pacific (IDA & IBRD countries)EcuadorEgypt, Arab Rep.El SalvadorEquatorial GuineaEritreaEstoniaEthiopiaEuro areaEurope & Central AsiaEurope & Central Asia (excluding high income)Europe & Central Asia (IDA & IBRD countries)European UnionFijiFinlandFragile and conflict affected situationsFranceFrench PolynesiaGabonGambia, TheGeorgiaGermanyGhanaGreeceGrenadaGuatemalaGuineaGuinea-BissauGuyanaHaitiHeavily indebted poor countries (HIPC)High incomeHondurasHong Kong SAR, ChinaHungaryIBRD onlyIcelandIDA & IBRD totalIDA blendIDA onlyIDA totalIndiaIndonesiaIran, Islamic Rep.IraqIrelandIsraelItalyJamaicaJapanJordanKazakhstanKenyaKiribatiKorea, Rep.KosovoKuwaitKyrgyz RepublicLao PDRLate-demographic dividendLatin America & Caribbean Latin America & Caribbean (excluding high income)Latin America & the Caribbean (IDA & IBRD countries)LatviaLeast developed countries: UN classificationLebanonLesothoLiberiaLibyaLithuaniaLow & middle incomeLow incomeLower middle incomeLuxembourgMacao SAR, ChinaMacedonia, FYRMadagascarMalawiMalaysiaMaldivesMaliMaltaMarshall IslandsMauritaniaMauritiusMexicoMicronesia, Fed. Sts.Middle East & North AfricaMiddle East & North Africa (excluding high income)Middle East & North Africa (IDA & IBRD countries)Middle incomeMoldovaMongoliaMontenegroMoroccoMozambiqueMyanmarNamibiaNauruNepalNetherlandsNew CaledoniaNew ZealandNicaraguaNigerNigeriaNorth AmericaNorwayOECD membersOmanOther small statesPacific island small statesPakistanPalauPanamaPapua New GuineaParaguayPeruPhilippinesPolandPortugalPost-demographic dividendPre-demographic dividendQatarRomaniaRussian FederationRwandaSamoaSao Tome and PrincipeSaudi ArabiaSenegalSerbiaSeychellesSierra LeoneSingaporeSlovak RepublicSloveniaSmall statesSolomon IslandsSomaliaSouth AfricaSouth AsiaSouth Asia (IDA & IBRD)South SudanSpainSri LankaSt. Kitts and NevisSt. LuciaSt. Vincent and the GrenadinesSub-Saharan Africa Sub-Saharan Africa (excluding high income)Sub-Saharan Africa (IDA & IBRD countries)SudanSurinameSwazilandSwedenSwitzerlandSyrian Arab RepublicTajikistanTanzaniaThailandTimor-LesteTogoTongaTrinidad and TobagoTunisiaTurkeyTurkmenistanTuvaluUgandaUkraineUnited Arab EmiratesUnited KingdomUnited StatesUpper middle incomeUruguayUzbekistanVanuatuVenezuela, RBVietnamWest Bank and GazaWorldYemen, Rep.ZambiaZimbabwe Timeline:
This timeline shows a graph from 1971 to 2016 of World. No data until 1970. Number of actual observations by date: 46.
Source name:
World Development Indicators
Source organization:
International Monetary Fund, International Financial Statistics and Balance of Payments databases, World Bank, International Debt Statistics, and World Bank and OECD GDP estimates.
Categories, topics:
Economy & Growth, Financial Sector, Climate Change
Last updated:
apr 23, 2017
Indicators value changes by year
At the date of observation
Value
Absolute change
Change from previous value
jan 1, 1971
0.499
+0.499
0.0%
jan 1, 1972
0.48
-0.019
-3.83%
jan 1, 1973
0.43
-0.05
-10.37%
jan 1, 1974
0.501
+0.071
16.45%
jan 1, 1975
0.51
+0.009
1.74%
jan 1, 1976
0.479
-0.03
-5.97%
jan 1, 1977
0.333
-0.146
-30.52%
jan 1, 1978
0.377
+0.044
13.17%
jan 1, 1979
0.404
+0.027
7.11%
jan 1, 1980
0.439
+0.035
8.7%
jan 1, 1981
0.513
+0.074
16.92%
jan 1, 1982
0.63
+0.117
22.86%
jan 1, 1983
0.516
-0.114
-18.08%
jan 1, 1984
0.438
-0.078
-15.1%
jan 1, 1985
0.501
+0.063
14.31%
jan 1, 1986
0.461
-0.04
-7.98%
jan 1, 1987
0.599
+0.138
29.85%
jan 1, 1988
0.797
+0.199
33.17%
jan 1, 1989
0.849
+0.052
6.5%
jan 1, 1990
0.995
+0.146
17.16%
jan 1, 1991
0.909
-0.086
-8.62%
jan 1, 1992
0.647
-0.263
-28.87%
jan 1, 1993
0.618
-0.028
-4.39%
jan 1, 1994
0.837
+0.218
35.31%
jan 1, 1995
0.891
+0.054
6.47%
jan 1, 1996
1.064
+0.173
19.41%
jan 1, 1997
1.181
+0.118
11.07%
jan 1, 1998
1.49
+0.309
26.16%
jan 1, 1999
2.207
+0.716
48.05%
jan 1, 2000
2.996
+0.79
35.8%
jan 1, 2001
4.379
+1.383
46.14%
jan 1, 2002
2.407
-1.972
-45.03%
jan 1, 2003
2.147
-0.26
-10.79%
jan 1, 2004
1.822
-0.326
-15.17%
jan 1, 2005
2.224
+0.403
22.11%
jan 1, 2006
3.232
+1.007
45.28%
jan 1, 2007
4.17
+0.938
29.03%
jan 1, 2008
5.235
+1.065
25.54%
jan 1, 2009
3.761
-1.474
-28.15%
jan 1, 2010
2.169
-1.592
-42.32%
jan 1, 2011
2.743
+0.574
26.44%
jan 1, 2012
3.032
+0.289
10.54%
jan 1, 2013
2.732
-0.3
-9.91%
jan 1, 2014
2.566
-0.166
-6.07%
jan 1, 2015
2.188
-0.377
-14.71%
jan 1, 2016
2.816
+0.627
28.66%
Ranking of countries by current statistics by years


Comments: