29
/
en
AIzaSyAYiBZKx7MnpbEhh9jyipgxe19OcubqV5w
April 1, 2024
73891
Austria
AUT
true
2
1
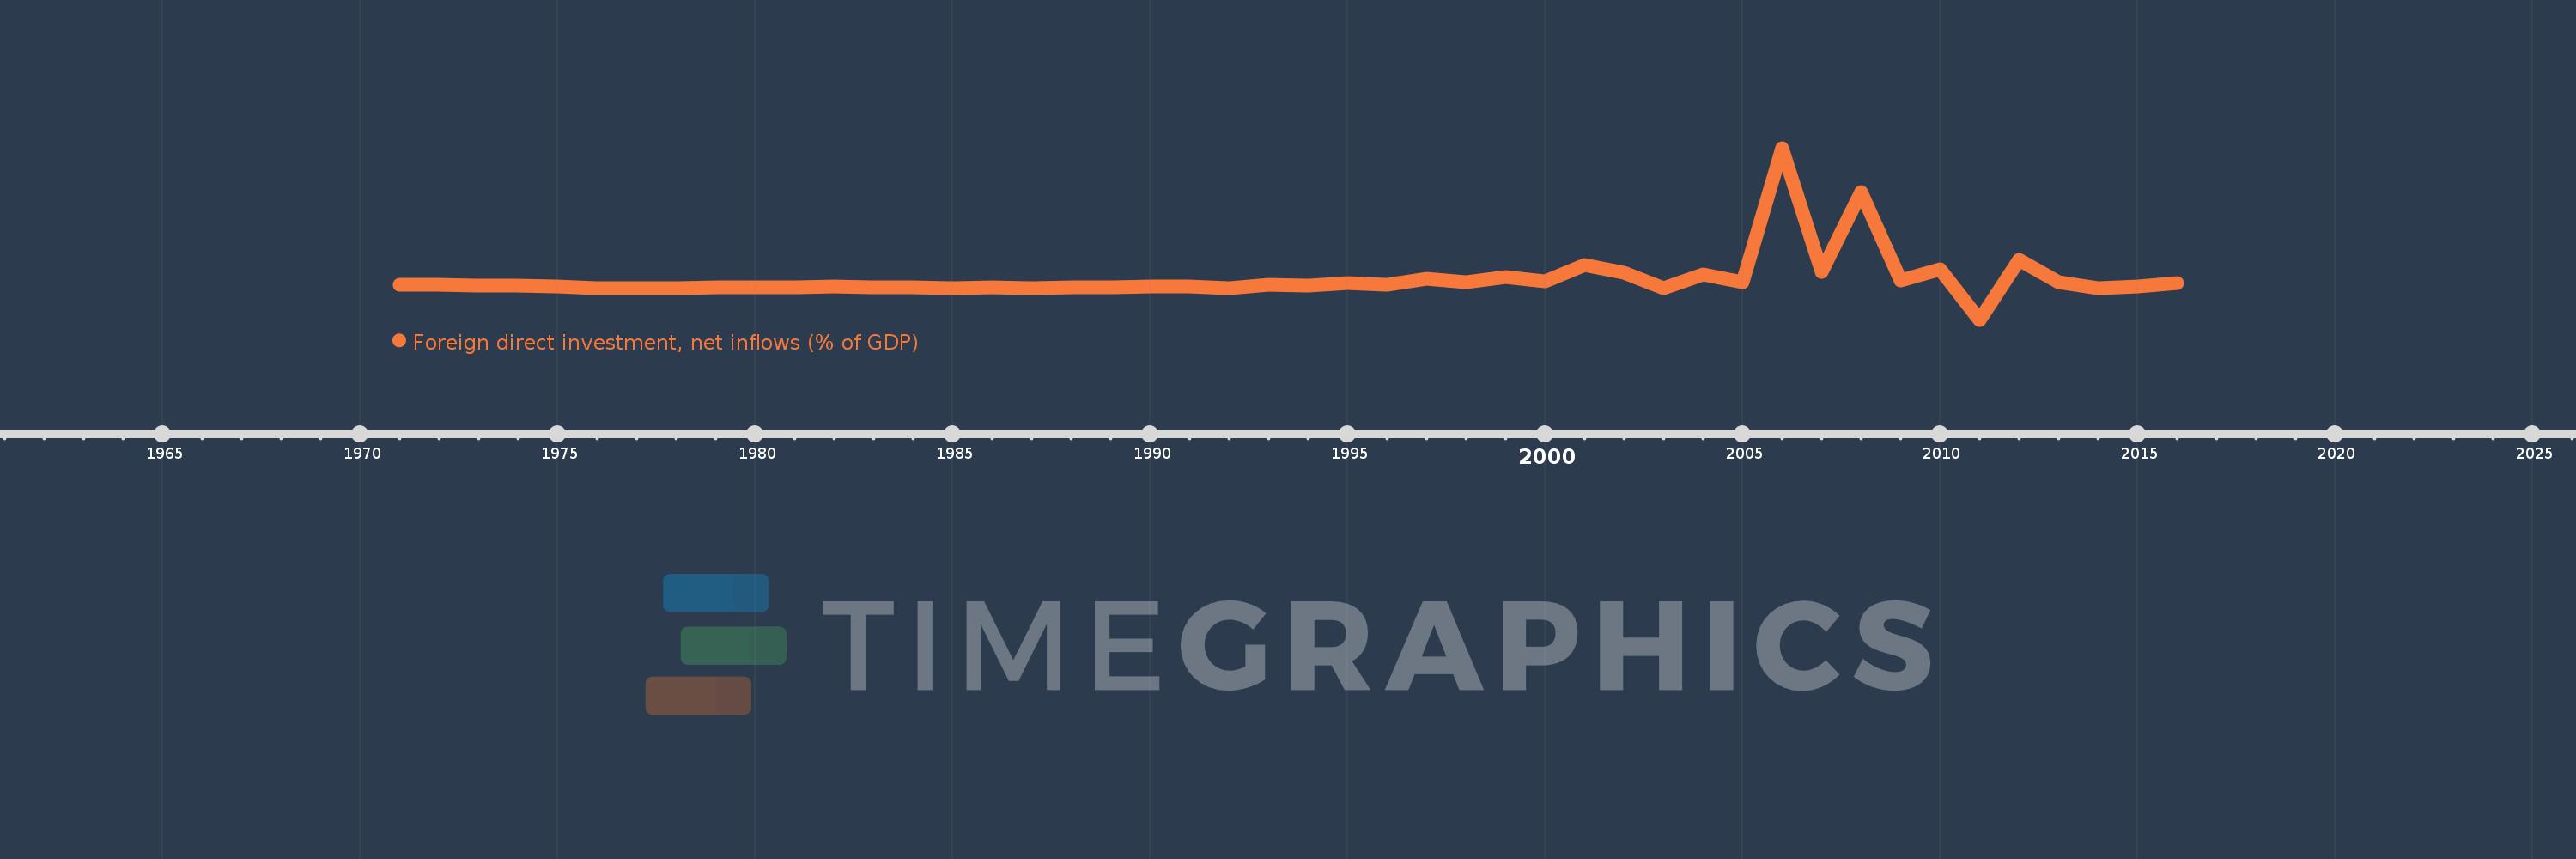
Foreign direct investment, net inflows (% of GDP)
2016,2015,2014,2013,2012,2011,2010,2009,2008,2007,2006,2005,2004,2003,2002,2001,2000,1999,1998,1997,1996,1995,1994,1993,1992,1991,1990,1989,1988,1987,1986,1985,1984,1983,1982,1981,1980,1979,1978,1977,1976,1975,1974,1973,1972,1971
This statistics in other country:
AfghanistanAlbaniaAlgeriaAngolaAntigua and BarbudaArab WorldArgentinaArmeniaArubaAustraliaAustriaAzerbaijanBahamas, TheBahrainBangladeshBarbadosBelarusBelgiumBelizeBeninBermudaBhutanBoliviaBosnia and HerzegovinaBotswanaBrazilBrunei DarussalamBulgariaBurkina FasoBurundiCabo VerdeCambodiaCameroonCanadaCaribbean small statesCayman IslandsCentral African RepublicCentral Europe and the BalticsChadChileChinaColombiaComorosCongo, Dem. Rep.Congo, Rep.Costa RicaCote d'IvoireCroatiaCyprusCzech RepublicDenmarkDjiboutiDominicaDominican RepublicEarly-demographic dividendEast Asia & PacificEast Asia & Pacific (excluding high income)East Asia & Pacific (IDA & IBRD countries)EcuadorEgypt, Arab Rep.El SalvadorEquatorial GuineaEritreaEstoniaEthiopiaEuro areaEurope & Central AsiaEurope & Central Asia (excluding high income)Europe & Central Asia (IDA & IBRD countries)European UnionFijiFinlandFragile and conflict affected situationsFranceFrench PolynesiaGabonGambia, TheGeorgiaGermanyGhanaGreeceGrenadaGuatemalaGuineaGuinea-BissauGuyanaHaitiHeavily indebted poor countries (HIPC)High incomeHondurasHong Kong SAR, ChinaHungaryIBRD onlyIcelandIDA & IBRD totalIDA blendIDA onlyIDA totalIndiaIndonesiaIran, Islamic Rep.IraqIrelandIsraelItalyJamaicaJapanJordanKazakhstanKenyaKiribatiKorea, Rep.KosovoKuwaitKyrgyz RepublicLao PDRLate-demographic dividendLatin America & Caribbean Latin America & Caribbean (excluding high income)Latin America & the Caribbean (IDA & IBRD countries)LatviaLeast developed countries: UN classificationLebanonLesothoLiberiaLibyaLithuaniaLow & middle incomeLow incomeLower middle incomeLuxembourgMacao SAR, ChinaMacedonia, FYRMadagascarMalawiMalaysiaMaldivesMaliMaltaMarshall IslandsMauritaniaMauritiusMexicoMicronesia, Fed. Sts.Middle East & North AfricaMiddle East & North Africa (excluding high income)Middle East & North Africa (IDA & IBRD countries)Middle incomeMoldovaMongoliaMontenegroMoroccoMozambiqueMyanmarNamibiaNauruNepalNetherlandsNew CaledoniaNew ZealandNicaraguaNigerNigeriaNorth AmericaNorwayOECD membersOmanOther small statesPacific island small statesPakistanPalauPanamaPapua New GuineaParaguayPeruPhilippinesPolandPortugalPost-demographic dividendPre-demographic dividendQatarRomaniaRussian FederationRwandaSamoaSao Tome and PrincipeSaudi ArabiaSenegalSerbiaSeychellesSierra LeoneSingaporeSlovak RepublicSloveniaSmall statesSolomon IslandsSomaliaSouth AfricaSouth AsiaSouth Asia (IDA & IBRD)South SudanSpainSri LankaSt. Kitts and NevisSt. LuciaSt. Vincent and the GrenadinesSub-Saharan Africa Sub-Saharan Africa (excluding high income)Sub-Saharan Africa (IDA & IBRD countries)SudanSurinameSwazilandSwedenSwitzerlandSyrian Arab RepublicTajikistanTanzaniaThailandTimor-LesteTogoTongaTrinidad and TobagoTunisiaTurkeyTurkmenistanTuvaluUgandaUkraineUnited Arab EmiratesUnited KingdomUnited StatesUpper middle incomeUruguayUzbekistanVanuatuVenezuela, RBVietnamWest Bank and GazaWorldYemen, Rep.ZambiaZimbabwe Timeline:
This timeline shows a graph from 1971 to 2016 of Austria. No data until 1970. Number of actual observations by date: 46.
Source name:
World Development Indicators
Source organization:
International Monetary Fund, International Financial Statistics and Balance of Payments databases, World Bank, International Debt Statistics, and World Bank and OECD GDP estimates.
Categories, topics:
Economy & Growth, Financial Sector, Climate Change
Last updated:
apr 23, 2017
Indicators value changes by year
Minimum:
-5.639
jan 1, 2011
Maximum:
25.834
jan 1, 2006
At the date of observation
Value
Absolute change
Change from previous value
jan 1, 1971
0.735
+0.735
0.0%
jan 1, 1972
0.801
+0.067
9.06%
jan 1, 1973
0.661
-0.14
-17.53%
jan 1, 1974
0.546
-0.115
-17.37%
jan 1, 1975
0.504
-0.042
-7.63%
jan 1, 1976
0.198
-0.306
-60.75%
jan 1, 1977
0.213
+0.015
7.53%
jan 1, 1978
0.188
-0.025
-11.56%
jan 1, 1979
0.23
+0.042
22.17%
jan 1, 1980
0.254
+0.024
10.47%
jan 1, 1981
0.292
+0.038
15.04%
jan 1, 1982
0.462
+0.17
58.11%
jan 1, 1983
0.292
-0.17
-36.73%
jan 1, 1984
0.3
+0.008
2.73%
jan 1, 1985
0.17
-0.13
-43.44%
jan 1, 1986
0.25
+0.08
47.18%
jan 1, 1987
0.189
-0.061
-24.5%
jan 1, 1988
0.331
+0.142
75.1%
jan 1, 1989
0.328
-0.003
-0.93%
jan 1, 1990
0.442
+0.115
35.04%
jan 1, 1991
0.393
-0.049
-11.07%
jan 1, 1992
0.208
-0.186
-47.2%
jan 1, 1993
0.741
+0.534
256.89%
jan 1, 1994
0.594
-0.147
-19.79%
jan 1, 1995
1.042
+0.448
75.34%
jan 1, 1996
0.79
-0.252
-24.18%
jan 1, 1997
1.865
+1.075
135.96%
jan 1, 1998
1.236
-0.629
-33.74%
jan 1, 1999
2.133
+0.897
72.61%
jan 1, 2000
1.388
-0.745
-34.92%
jan 1, 2001
4.34
+2.952
212.69%
jan 1, 2002
2.999
-1.342
-30.91%
jan 1, 2003
0.149
-2.849
-95.02%
jan 1, 2004
2.723
+2.573
1.72K%
jan 1, 2005
1.298
-1.425
-52.33%
jan 1, 2006
25.834
+24.537
1.89K%
jan 1, 2007
3.14
-22.694
-87.85%
jan 1, 2008
17.825
+14.685
467.66%
jan 1, 2009
1.476
-16.349
-91.72%
jan 1, 2010
3.595
+2.119
143.59%
jan 1, 2011
-5.639
-9.234
-256.86%
jan 1, 2012
5.355
+10.994
-194.97%
jan 1, 2013
1.281
-4.074
-76.08%
jan 1, 2014
0.105
-1.176
-91.77%
jan 1, 2015
0.391
+0.286
271.23%
jan 1, 2016
1.141
+0.75
191.73%
Ranking of countries by current statistics by years


Comments: