29
/
en
AIzaSyAYiBZKx7MnpbEhh9jyipgxe19OcubqV5w
April 1, 2024
55510
Pre-demographic dividend
PRE
false
2
1
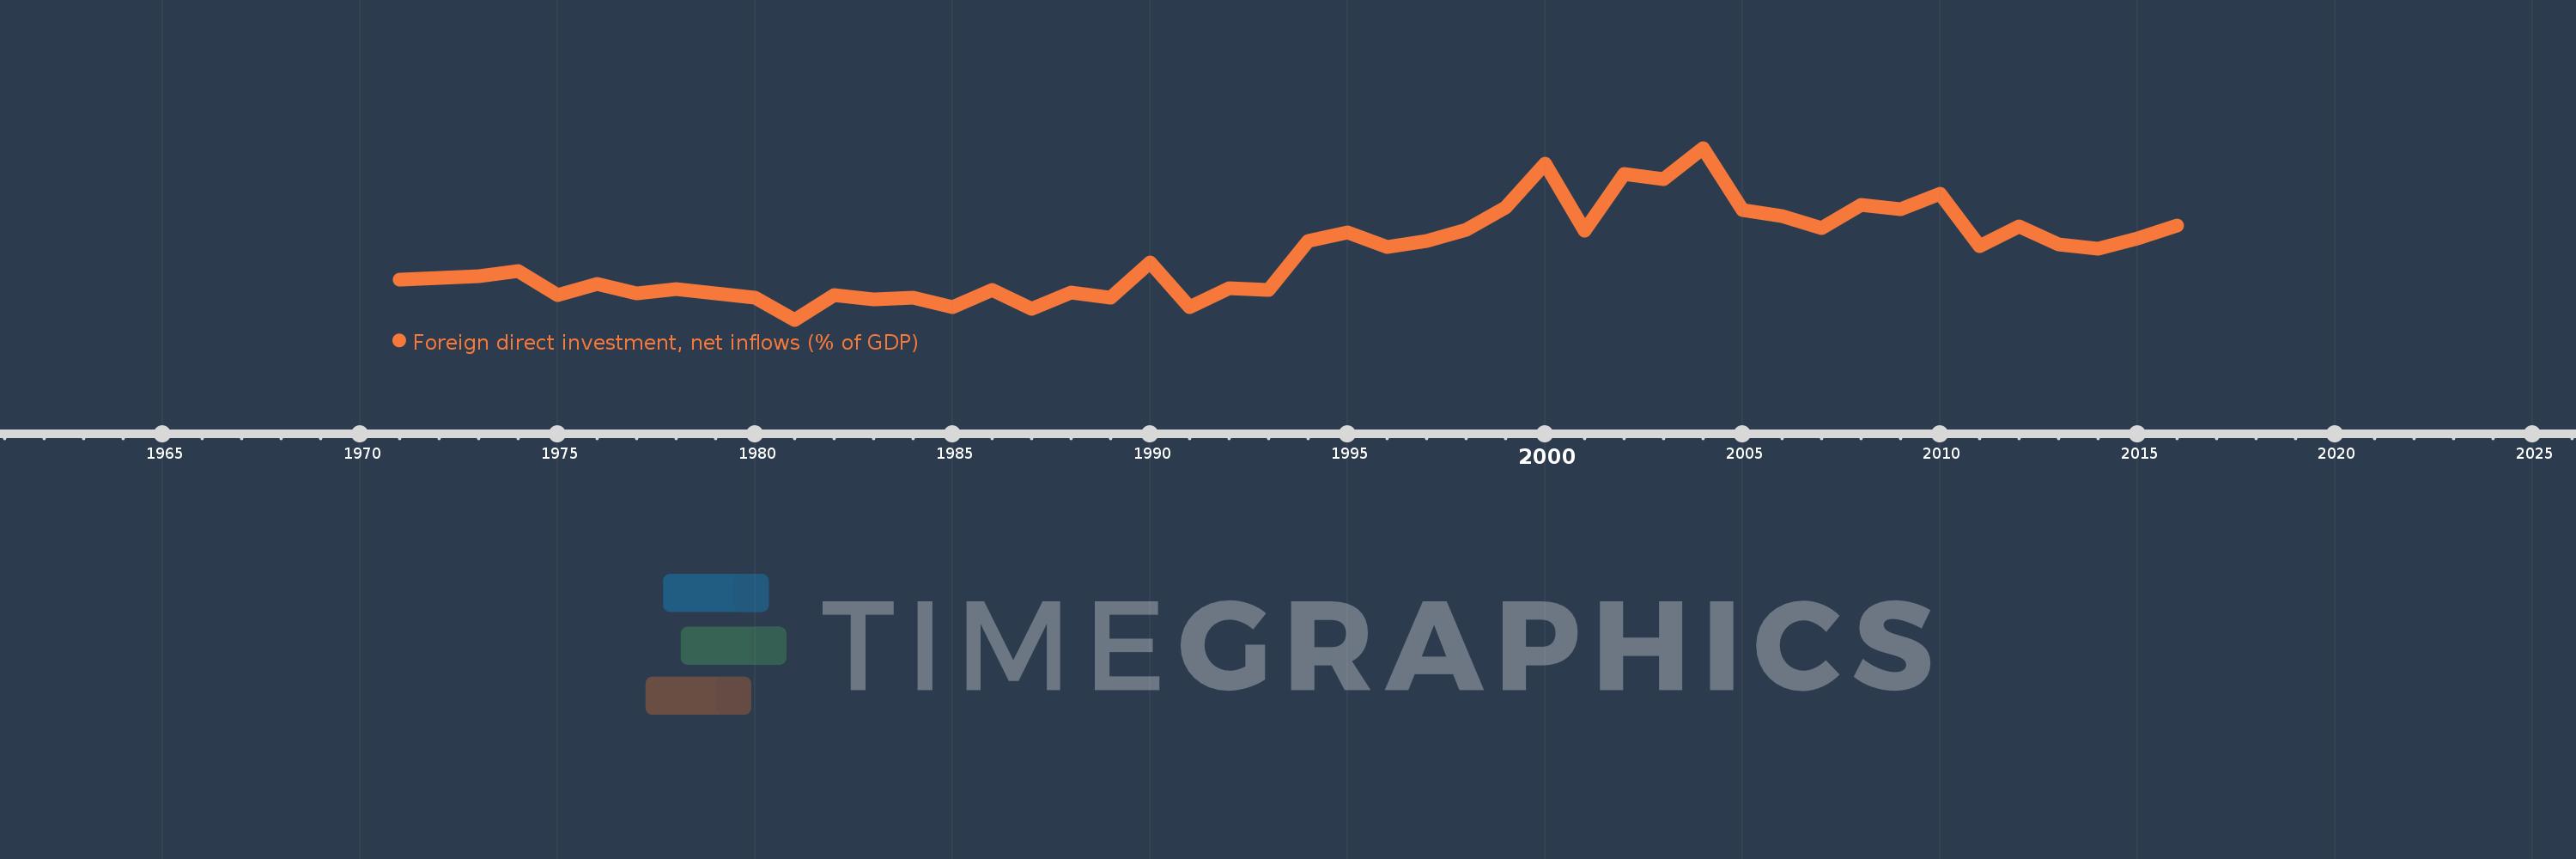
Foreign direct investment, net inflows (% of GDP)
2016,2015,2014,2013,2012,2011,2010,2009,2008,2007,2006,2005,2004,2003,2002,2001,2000,1999,1998,1997,1996,1995,1994,1993,1992,1991,1990,1989,1988,1987,1986,1985,1984,1983,1982,1981,1980,1979,1978,1977,1976,1975,1974,1973,1972,1971
This statistics in other country:
AfghanistanAlbaniaAlgeriaAngolaAntigua and BarbudaArab WorldArgentinaArmeniaArubaAustraliaAustriaAzerbaijanBahamas, TheBahrainBangladeshBarbadosBelarusBelgiumBelizeBeninBermudaBhutanBoliviaBosnia and HerzegovinaBotswanaBrazilBrunei DarussalamBulgariaBurkina FasoBurundiCabo VerdeCambodiaCameroonCanadaCaribbean small statesCayman IslandsCentral African RepublicCentral Europe and the BalticsChadChileChinaColombiaComorosCongo, Dem. Rep.Congo, Rep.Costa RicaCote d'IvoireCroatiaCyprusCzech RepublicDenmarkDjiboutiDominicaDominican RepublicEarly-demographic dividendEast Asia & PacificEast Asia & Pacific (excluding high income)East Asia & Pacific (IDA & IBRD countries)EcuadorEgypt, Arab Rep.El SalvadorEquatorial GuineaEritreaEstoniaEthiopiaEuro areaEurope & Central AsiaEurope & Central Asia (excluding high income)Europe & Central Asia (IDA & IBRD countries)European UnionFijiFinlandFragile and conflict affected situationsFranceFrench PolynesiaGabonGambia, TheGeorgiaGermanyGhanaGreeceGrenadaGuatemalaGuineaGuinea-BissauGuyanaHaitiHeavily indebted poor countries (HIPC)High incomeHondurasHong Kong SAR, ChinaHungaryIBRD onlyIcelandIDA & IBRD totalIDA blendIDA onlyIDA totalIndiaIndonesiaIran, Islamic Rep.IraqIrelandIsraelItalyJamaicaJapanJordanKazakhstanKenyaKiribatiKorea, Rep.KosovoKuwaitKyrgyz RepublicLao PDRLate-demographic dividendLatin America & Caribbean Latin America & Caribbean (excluding high income)Latin America & the Caribbean (IDA & IBRD countries)LatviaLeast developed countries: UN classificationLebanonLesothoLiberiaLibyaLithuaniaLow & middle incomeLow incomeLower middle incomeLuxembourgMacao SAR, ChinaMacedonia, FYRMadagascarMalawiMalaysiaMaldivesMaliMaltaMarshall IslandsMauritaniaMauritiusMexicoMicronesia, Fed. Sts.Middle East & North AfricaMiddle East & North Africa (excluding high income)Middle East & North Africa (IDA & IBRD countries)Middle incomeMoldovaMongoliaMontenegroMoroccoMozambiqueMyanmarNamibiaNauruNepalNetherlandsNew CaledoniaNew ZealandNicaraguaNigerNigeriaNorth AmericaNorwayOECD membersOmanOther small statesPacific island small statesPakistanPalauPanamaPapua New GuineaParaguayPeruPhilippinesPolandPortugalPost-demographic dividendPre-demographic dividendQatarRomaniaRussian FederationRwandaSamoaSao Tome and PrincipeSaudi ArabiaSenegalSerbiaSeychellesSierra LeoneSingaporeSlovak RepublicSloveniaSmall statesSolomon IslandsSomaliaSouth AfricaSouth AsiaSouth Asia (IDA & IBRD)South SudanSpainSri LankaSt. Kitts and NevisSt. LuciaSt. Vincent and the GrenadinesSub-Saharan Africa Sub-Saharan Africa (excluding high income)Sub-Saharan Africa (IDA & IBRD countries)SudanSurinameSwazilandSwedenSwitzerlandSyrian Arab RepublicTajikistanTanzaniaThailandTimor-LesteTogoTongaTrinidad and TobagoTunisiaTurkeyTurkmenistanTuvaluUgandaUkraineUnited Arab EmiratesUnited KingdomUnited StatesUpper middle incomeUruguayUzbekistanVanuatuVenezuela, RBVietnamWest Bank and GazaWorldYemen, Rep.ZambiaZimbabwe Timeline:
This timeline shows a graph from 1971 to 2016 of Pre-demographic dividend. No data until 1970. Number of actual observations by date: 46.
Source name:
World Development Indicators
Source organization:
International Monetary Fund, International Financial Statistics and Balance of Payments databases, World Bank, International Debt Statistics, and World Bank and OECD GDP estimates.
Categories, topics:
Economy & Growth, Financial Sector, Climate Change
Last updated:
apr 23, 2017
Indicators value changes by year
Minimum:
-0.053
jan 1, 1981
At the date of observation
Value
Absolute change
Change from previous value
jan 1, 1971
1.128
+1.128
0.0%
jan 1, 1972
1.164
+0.036
3.2%
jan 1, 1973
1.227
+0.063
5.41%
jan 1, 1974
1.376
+0.15
12.22%
jan 1, 1975
0.672
-0.705
-51.19%
jan 1, 1976
1.002
+0.331
49.22%
jan 1, 1977
0.719
-0.283
-28.28%
jan 1, 1978
0.832
+0.113
15.72%
jan 1, 1979
0.712
-0.12
-14.37%
jan 1, 1980
0.582
-0.131
-18.33%
jan 1, 1981
-0.053
-0.635
-109.14%
jan 1, 1982
0.666
+0.72
-1.35K%
jan 1, 1983
0.541
-0.125
-18.81%
jan 1, 1984
0.584
+0.043
7.91%
jan 1, 1985
0.326
-0.258
-44.16%
jan 1, 1986
0.812
+0.486
148.9%
jan 1, 1987
0.27
-0.542
-66.76%
jan 1, 1988
0.735
+0.465
172.31%
jan 1, 1989
0.601
-0.133
-18.16%
jan 1, 1990
1.629
+1.028
170.97%
jan 1, 1991
0.318
-1.312
-80.51%
jan 1, 1992
0.873
+0.555
174.93%
jan 1, 1993
0.816
-0.057
-6.5%
jan 1, 1994
2.232
+1.416
173.48%
jan 1, 1995
2.494
+0.261
11.7%
jan 1, 1996
2.06
-0.433
-17.38%
jan 1, 1997
2.253
+0.193
9.37%
jan 1, 1998
2.576
+0.323
14.31%
jan 1, 1999
3.217
+0.642
24.92%
jan 1, 2000
4.486
+1.268
39.42%
jan 1, 2001
2.535
-1.95
-43.48%
jan 1, 2002
4.187
+1.651
65.13%
jan 1, 2003
4.043
-0.144
-3.45%
jan 1, 2004
4.955
+0.913
22.58%
jan 1, 2005
3.139
-1.817
-36.66%
jan 1, 2006
2.968
-0.17
-5.42%
jan 1, 2007
2.613
-0.355
-11.97%
jan 1, 2008
3.305
+0.692
26.48%
jan 1, 2009
3.167
-0.138
-4.17%
jan 1, 2010
3.623
+0.455
14.37%
jan 1, 2011
2.082
-1.541
-42.54%
jan 1, 2012
2.676
+0.595
28.56%
jan 1, 2013
2.15
-0.526
-19.67%
jan 1, 2014
2.008
-0.141
-6.58%
jan 1, 2015
2.323
+0.314
15.64%
jan 1, 2016
2.702
+0.38
16.35%
Ranking of countries by current statistics by years


Comments: