29
/
en
AIzaSyAYiBZKx7MnpbEhh9jyipgxe19OcubqV5w
April 1, 2024
82762
Belize
BLZ
true
2
1
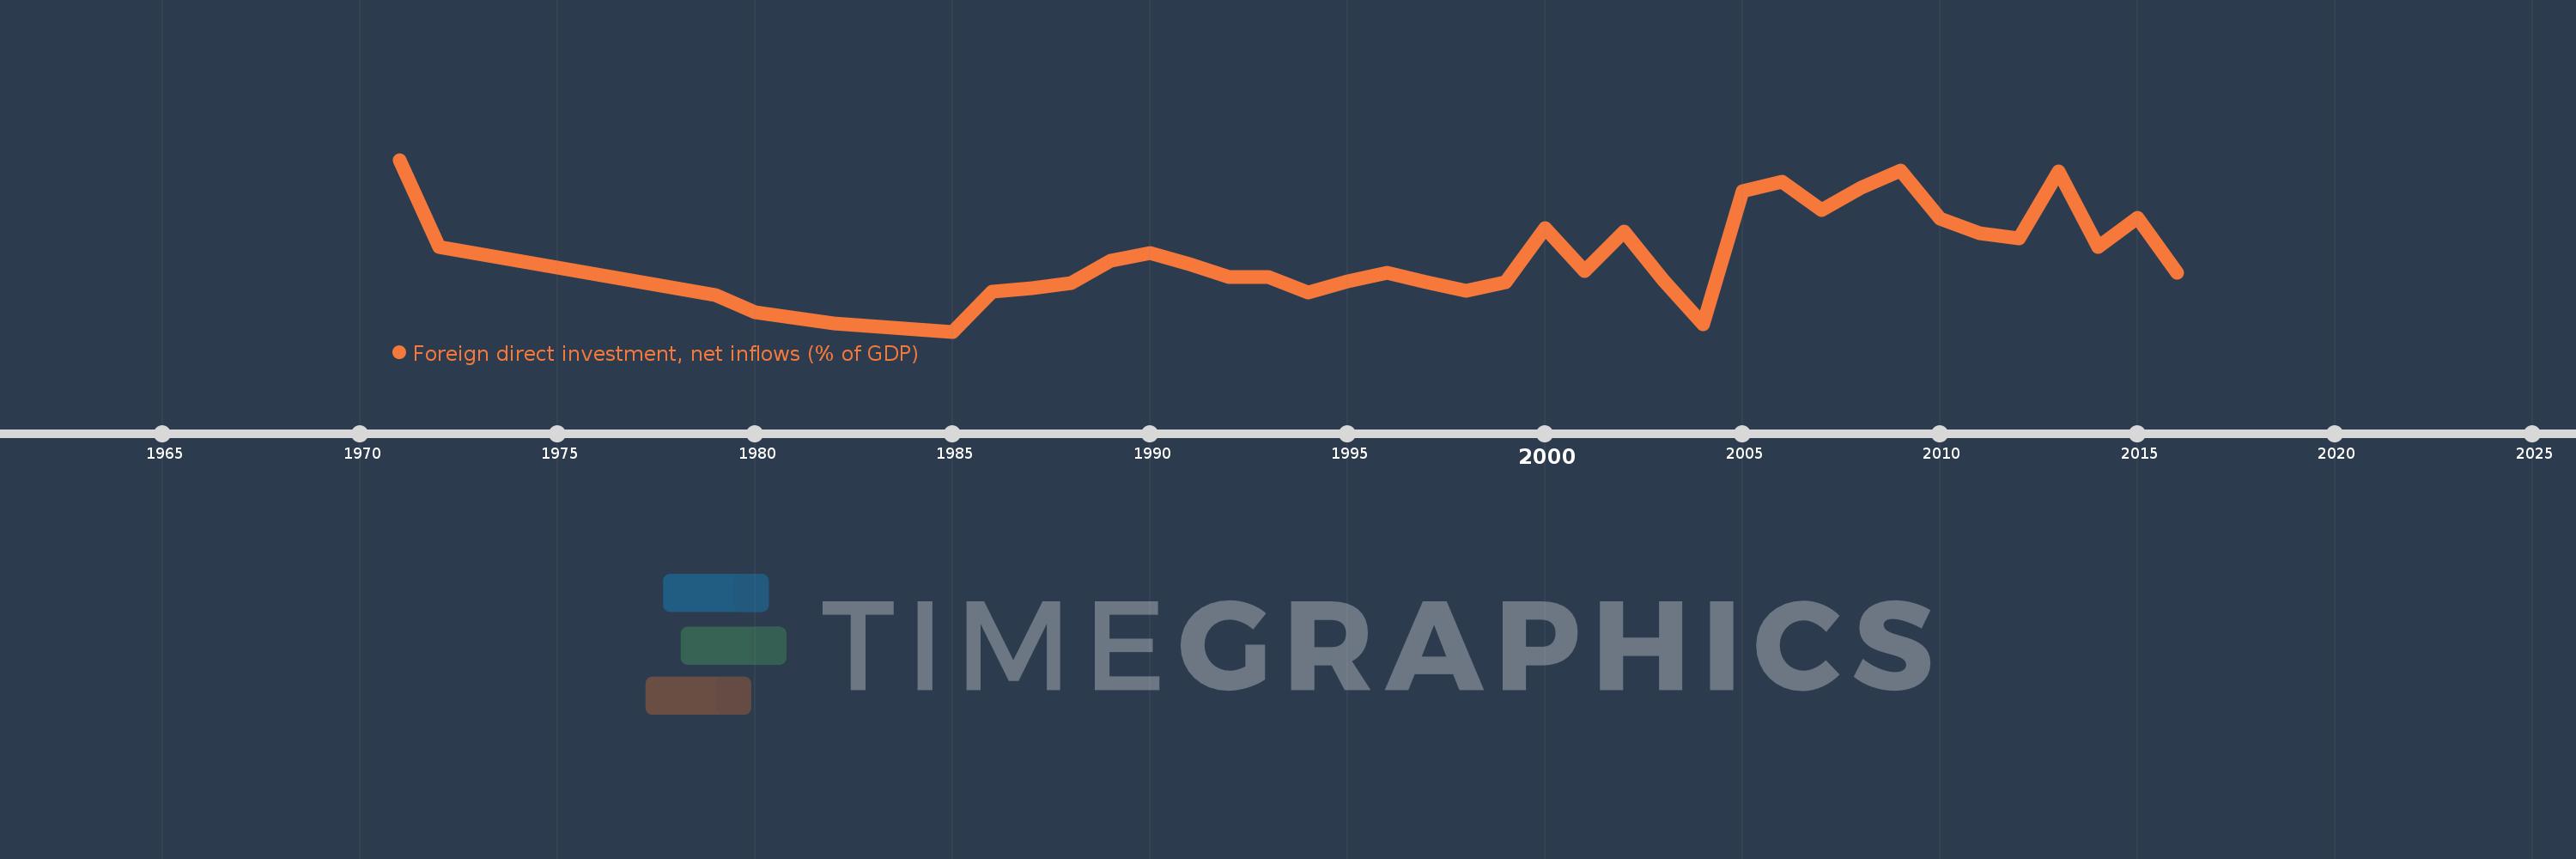
Foreign direct investment, net inflows (% of GDP)
2016,2015,2014,2013,2012,2011,2010,2009,2008,2007,2006,2005,2004,2003,2002,2001,2000,1999,1998,1997,1996,1995,1994,1993,1992,1991,1990,1989,1988,1987,1986,1985,1982,1980,1979,1972,1971
This statistics in other country:
AfghanistanAlbaniaAlgeriaAngolaAntigua and BarbudaArab WorldArgentinaArmeniaArubaAustraliaAustriaAzerbaijanBahamas, TheBahrainBangladeshBarbadosBelarusBelgiumBelizeBeninBermudaBhutanBoliviaBosnia and HerzegovinaBotswanaBrazilBrunei DarussalamBulgariaBurkina FasoBurundiCabo VerdeCambodiaCameroonCanadaCaribbean small statesCayman IslandsCentral African RepublicCentral Europe and the BalticsChadChileChinaColombiaComorosCongo, Dem. Rep.Congo, Rep.Costa RicaCote d'IvoireCroatiaCyprusCzech RepublicDenmarkDjiboutiDominicaDominican RepublicEarly-demographic dividendEast Asia & PacificEast Asia & Pacific (excluding high income)East Asia & Pacific (IDA & IBRD countries)EcuadorEgypt, Arab Rep.El SalvadorEquatorial GuineaEritreaEstoniaEthiopiaEuro areaEurope & Central AsiaEurope & Central Asia (excluding high income)Europe & Central Asia (IDA & IBRD countries)European UnionFijiFinlandFragile and conflict affected situationsFranceFrench PolynesiaGabonGambia, TheGeorgiaGermanyGhanaGreeceGrenadaGuatemalaGuineaGuinea-BissauGuyanaHaitiHeavily indebted poor countries (HIPC)High incomeHondurasHong Kong SAR, ChinaHungaryIBRD onlyIcelandIDA & IBRD totalIDA blendIDA onlyIDA totalIndiaIndonesiaIran, Islamic Rep.IraqIrelandIsraelItalyJamaicaJapanJordanKazakhstanKenyaKiribatiKorea, Rep.KosovoKuwaitKyrgyz RepublicLao PDRLate-demographic dividendLatin America & Caribbean Latin America & Caribbean (excluding high income)Latin America & the Caribbean (IDA & IBRD countries)LatviaLeast developed countries: UN classificationLebanonLesothoLiberiaLibyaLithuaniaLow & middle incomeLow incomeLower middle incomeLuxembourgMacao SAR, ChinaMacedonia, FYRMadagascarMalawiMalaysiaMaldivesMaliMaltaMarshall IslandsMauritaniaMauritiusMexicoMicronesia, Fed. Sts.Middle East & North AfricaMiddle East & North Africa (excluding high income)Middle East & North Africa (IDA & IBRD countries)Middle incomeMoldovaMongoliaMontenegroMoroccoMozambiqueMyanmarNamibiaNauruNepalNetherlandsNew CaledoniaNew ZealandNicaraguaNigerNigeriaNorth AmericaNorwayOECD membersOmanOther small statesPacific island small statesPakistanPalauPanamaPapua New GuineaParaguayPeruPhilippinesPolandPortugalPost-demographic dividendPre-demographic dividendQatarRomaniaRussian FederationRwandaSamoaSao Tome and PrincipeSaudi ArabiaSenegalSerbiaSeychellesSierra LeoneSingaporeSlovak RepublicSloveniaSmall statesSolomon IslandsSomaliaSouth AfricaSouth AsiaSouth Asia (IDA & IBRD)South SudanSpainSri LankaSt. Kitts and NevisSt. LuciaSt. Vincent and the GrenadinesSub-Saharan Africa Sub-Saharan Africa (excluding high income)Sub-Saharan Africa (IDA & IBRD countries)SudanSurinameSwazilandSwedenSwitzerlandSyrian Arab RepublicTajikistanTanzaniaThailandTimor-LesteTogoTongaTrinidad and TobagoTunisiaTurkeyTurkmenistanTuvaluUgandaUkraineUnited Arab EmiratesUnited KingdomUnited StatesUpper middle incomeUruguayUzbekistanVanuatuVenezuela, RBVietnamWest Bank and GazaWorldYemen, Rep.ZambiaZimbabwe Timeline:
This timeline shows a graph from 1971 to 2016 of Belize. No data until 1970. Number of actual observations by date: 37.
Source name:
World Development Indicators
Source organization:
International Monetary Fund, International Financial Statistics and Balance of Payments databases, World Bank, International Debt Statistics, and World Bank and OECD GDP estimates.
Categories, topics:
Economy & Growth, Financial Sector, Climate Change
Last updated:
apr 23, 2017
Indicators value changes by year
Minimum:
-1.754
jan 1, 1985
Maximum:
13.319
jan 1, 1971
At the date of observation
Value
Absolute change
Change from previous value
jan 1, 1971
13.319
+13.319
0.0%
jan 1, 1972
5.641
-7.677
-57.64%
jan 1, 1979
1.467
-4.174
-73.99%
jan 1, 1980
-0.033
-1.5
-102.24%
jan 1, 1982
-1.037
-1.004
3.05K%
jan 1, 1985
-1.754
-0.718
69.21%
jan 1, 1986
1.769
+3.523
-200.84%
jan 1, 1987
2.019
+0.25
14.12%
jan 1, 1988
2.477
+0.458
22.69%
jan 1, 1989
4.446
+1.969
79.49%
jan 1, 1990
5.136
+0.69
15.51%
jan 1, 1991
4.164
-0.971
-18.92%
jan 1, 1992
3.058
-1.106
-26.56%
jan 1, 1993
3.01
-0.048
-1.57%
jan 1, 1994
1.643
-1.367
-45.41%
jan 1, 1995
2.646
+1.003
61.02%
jan 1, 1996
3.394
+0.748
28.29%
jan 1, 1997
2.585
-0.809
-23.84%
jan 1, 1998
1.827
-0.758
-29.32%
jan 1, 1999
2.562
+0.735
40.21%
jan 1, 2000
7.312
+4.751
185.44%
jan 1, 2001
3.553
-3.759
-51.41%
jan 1, 2002
7.017
+3.463
97.48%
jan 1, 2003
2.73
-4.286
-61.09%
jan 1, 2004
-1.103
-3.833
-140.4%
jan 1, 2005
10.54
+11.643
-1.06K%
jan 1, 2006
11.39
+0.85
8.06%
jan 1, 2007
8.939
-2.451
-21.52%
jan 1, 2008
10.877
+1.938
21.68%
jan 1, 2009
12.388
+1.511
13.89%
jan 1, 2010
8.131
-4.257
-34.36%
jan 1, 2011
6.897
-1.234
-15.18%
jan 1, 2012
6.404
-0.493
-7.15%
jan 1, 2013
12.339
+5.935
92.68%
jan 1, 2014
5.674
-6.665
-54.02%
jan 1, 2015
8.214
+2.54
44.76%
jan 1, 2016
3.373
-4.841
-58.94%
Ranking of countries by current statistics by years


Comments: