29
/
en
AIzaSyAYiBZKx7MnpbEhh9jyipgxe19OcubqV5w
April 1, 2024
35723
High income
HIC
false
2
1
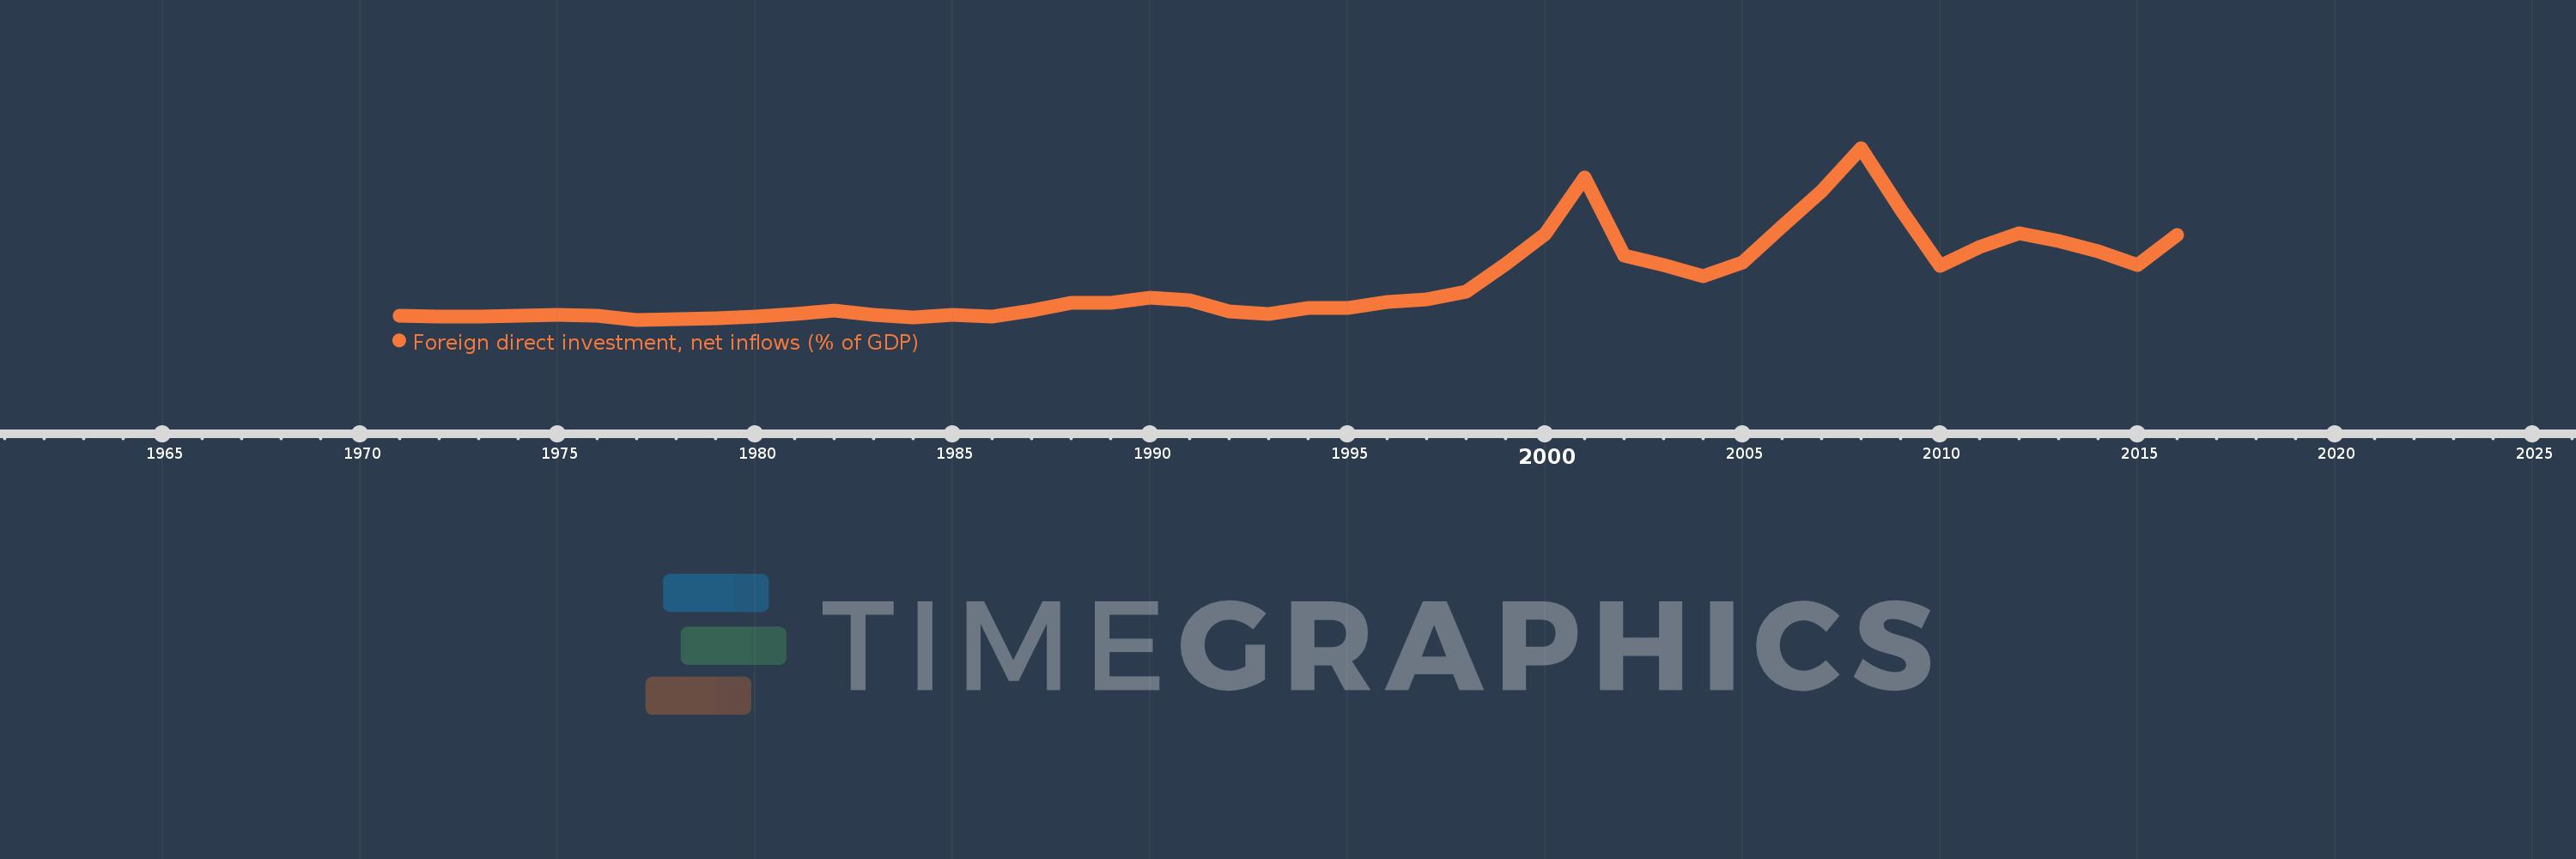
Foreign direct investment, net inflows (% of GDP)
2016,2015,2014,2013,2012,2011,2010,2009,2008,2007,2006,2005,2004,2003,2002,2001,2000,1999,1998,1997,1996,1995,1994,1993,1992,1991,1990,1989,1988,1987,1986,1985,1984,1983,1982,1981,1980,1979,1978,1977,1976,1975,1974,1973,1972,1971
This statistics in other country:
AfghanistanAlbaniaAlgeriaAngolaAntigua and BarbudaArab WorldArgentinaArmeniaArubaAustraliaAustriaAzerbaijanBahamas, TheBahrainBangladeshBarbadosBelarusBelgiumBelizeBeninBermudaBhutanBoliviaBosnia and HerzegovinaBotswanaBrazilBrunei DarussalamBulgariaBurkina FasoBurundiCabo VerdeCambodiaCameroonCanadaCaribbean small statesCayman IslandsCentral African RepublicCentral Europe and the BalticsChadChileChinaColombiaComorosCongo, Dem. Rep.Congo, Rep.Costa RicaCote d'IvoireCroatiaCyprusCzech RepublicDenmarkDjiboutiDominicaDominican RepublicEarly-demographic dividendEast Asia & PacificEast Asia & Pacific (excluding high income)East Asia & Pacific (IDA & IBRD countries)EcuadorEgypt, Arab Rep.El SalvadorEquatorial GuineaEritreaEstoniaEthiopiaEuro areaEurope & Central AsiaEurope & Central Asia (excluding high income)Europe & Central Asia (IDA & IBRD countries)European UnionFijiFinlandFragile and conflict affected situationsFranceFrench PolynesiaGabonGambia, TheGeorgiaGermanyGhanaGreeceGrenadaGuatemalaGuineaGuinea-BissauGuyanaHaitiHeavily indebted poor countries (HIPC)High incomeHondurasHong Kong SAR, ChinaHungaryIBRD onlyIcelandIDA & IBRD totalIDA blendIDA onlyIDA totalIndiaIndonesiaIran, Islamic Rep.IraqIrelandIsraelItalyJamaicaJapanJordanKazakhstanKenyaKiribatiKorea, Rep.KosovoKuwaitKyrgyz RepublicLao PDRLate-demographic dividendLatin America & Caribbean Latin America & Caribbean (excluding high income)Latin America & the Caribbean (IDA & IBRD countries)LatviaLeast developed countries: UN classificationLebanonLesothoLiberiaLibyaLithuaniaLow & middle incomeLow incomeLower middle incomeLuxembourgMacao SAR, ChinaMacedonia, FYRMadagascarMalawiMalaysiaMaldivesMaliMaltaMarshall IslandsMauritaniaMauritiusMexicoMicronesia, Fed. Sts.Middle East & North AfricaMiddle East & North Africa (excluding high income)Middle East & North Africa (IDA & IBRD countries)Middle incomeMoldovaMongoliaMontenegroMoroccoMozambiqueMyanmarNamibiaNauruNepalNetherlandsNew CaledoniaNew ZealandNicaraguaNigerNigeriaNorth AmericaNorwayOECD membersOmanOther small statesPacific island small statesPakistanPalauPanamaPapua New GuineaParaguayPeruPhilippinesPolandPortugalPost-demographic dividendPre-demographic dividendQatarRomaniaRussian FederationRwandaSamoaSao Tome and PrincipeSaudi ArabiaSenegalSerbiaSeychellesSierra LeoneSingaporeSlovak RepublicSloveniaSmall statesSolomon IslandsSomaliaSouth AfricaSouth AsiaSouth Asia (IDA & IBRD)South SudanSpainSri LankaSt. Kitts and NevisSt. LuciaSt. Vincent and the GrenadinesSub-Saharan Africa Sub-Saharan Africa (excluding high income)Sub-Saharan Africa (IDA & IBRD countries)SudanSurinameSwazilandSwedenSwitzerlandSyrian Arab RepublicTajikistanTanzaniaThailandTimor-LesteTogoTongaTrinidad and TobagoTunisiaTurkeyTurkmenistanTuvaluUgandaUkraineUnited Arab EmiratesUnited KingdomUnited StatesUpper middle incomeUruguayUzbekistanVanuatuVenezuela, RBVietnamWest Bank and GazaWorldYemen, Rep.ZambiaZimbabwe Timeline:
This timeline shows a graph from 1971 to 2016 of High income. No data until 1970. Number of actual observations by date: 46.
Source name:
World Development Indicators
Source organization:
International Monetary Fund, International Financial Statistics and Balance of Payments databases, World Bank, International Debt Statistics, and World Bank and OECD GDP estimates.
Categories, topics:
Economy & Growth, Financial Sector, Climate Change
Last updated:
apr 23, 2017
Indicators value changes by year
At the date of observation
Value
Absolute change
Change from previous value
jan 1, 1971
0.462
+0.462
0.0%
jan 1, 1972
0.449
-0.013
-2.8%
jan 1, 1973
0.433
-0.016
-3.5%
jan 1, 1974
0.478
+0.045
10.36%
jan 1, 1975
0.491
+0.014
2.83%
jan 1, 1976
0.466
-0.025
-5.1%
jan 1, 1977
0.345
-0.121
-26.01%
jan 1, 1978
0.375
+0.03
8.79%
jan 1, 1979
0.39
+0.014
3.86%
jan 1, 1980
0.434
+0.044
11.39%
jan 1, 1981
0.517
+0.083
19.07%
jan 1, 1982
0.621
+0.104
20.17%
jan 1, 1983
0.502
-0.12
-19.25%
jan 1, 1984
0.425
-0.077
-15.35%
jan 1, 1985
0.51
+0.085
19.98%
jan 1, 1986
0.445
-0.065
-12.75%
jan 1, 1987
0.631
+0.186
41.9%
jan 1, 1988
0.859
+0.229
36.23%
jan 1, 1989
0.875
+0.016
1.81%
jan 1, 1990
1.03
+0.155
17.69%
jan 1, 1991
0.95
-0.08
-7.77%
jan 1, 1992
0.6
-0.35
-36.81%
jan 1, 1993
0.528
-0.072
-12.05%
jan 1, 1994
0.705
+0.178
33.65%
jan 1, 1995
0.702
-0.004
-0.51%
jan 1, 1996
0.906
+0.204
29.06%
jan 1, 1997
0.986
+0.08
8.85%
jan 1, 1998
1.229
+0.243
24.62%
jan 1, 1999
2.09
+0.861
70.08%
jan 1, 2000
3.024
+0.934
44.7%
jan 1, 2001
4.787
+1.763
58.31%
jan 1, 2002
2.345
-2.441
-51.01%
jan 1, 2003
2.061
-0.284
-12.12%
jan 1, 2004
1.704
-0.356
-17.3%
jan 1, 2005
2.122
+0.417
24.47%
jan 1, 2006
3.263
+1.142
53.81%
jan 1, 2007
4.363
+1.1
33.71%
jan 1, 2008
5.698
+1.335
30.59%
jan 1, 2009
3.801
-1.896
-33.28%
jan 1, 2010
2.027
-1.774
-46.68%
jan 1, 2011
2.607
+0.58
28.64%
jan 1, 2012
3.027
+0.419
16.08%
jan 1, 2013
2.801
-0.226
-7.47%
jan 1, 2014
2.471
-0.329
-11.75%
jan 1, 2015
2.054
-0.417
-16.89%
jan 1, 2016
2.996
+0.942
45.87%
Ranking of countries by current statistics by years


Comments: