29
/
en
AIzaSyAYiBZKx7MnpbEhh9jyipgxe19OcubqV5w
April 1, 2024
54765
Post-demographic dividend
PST
false
2
1
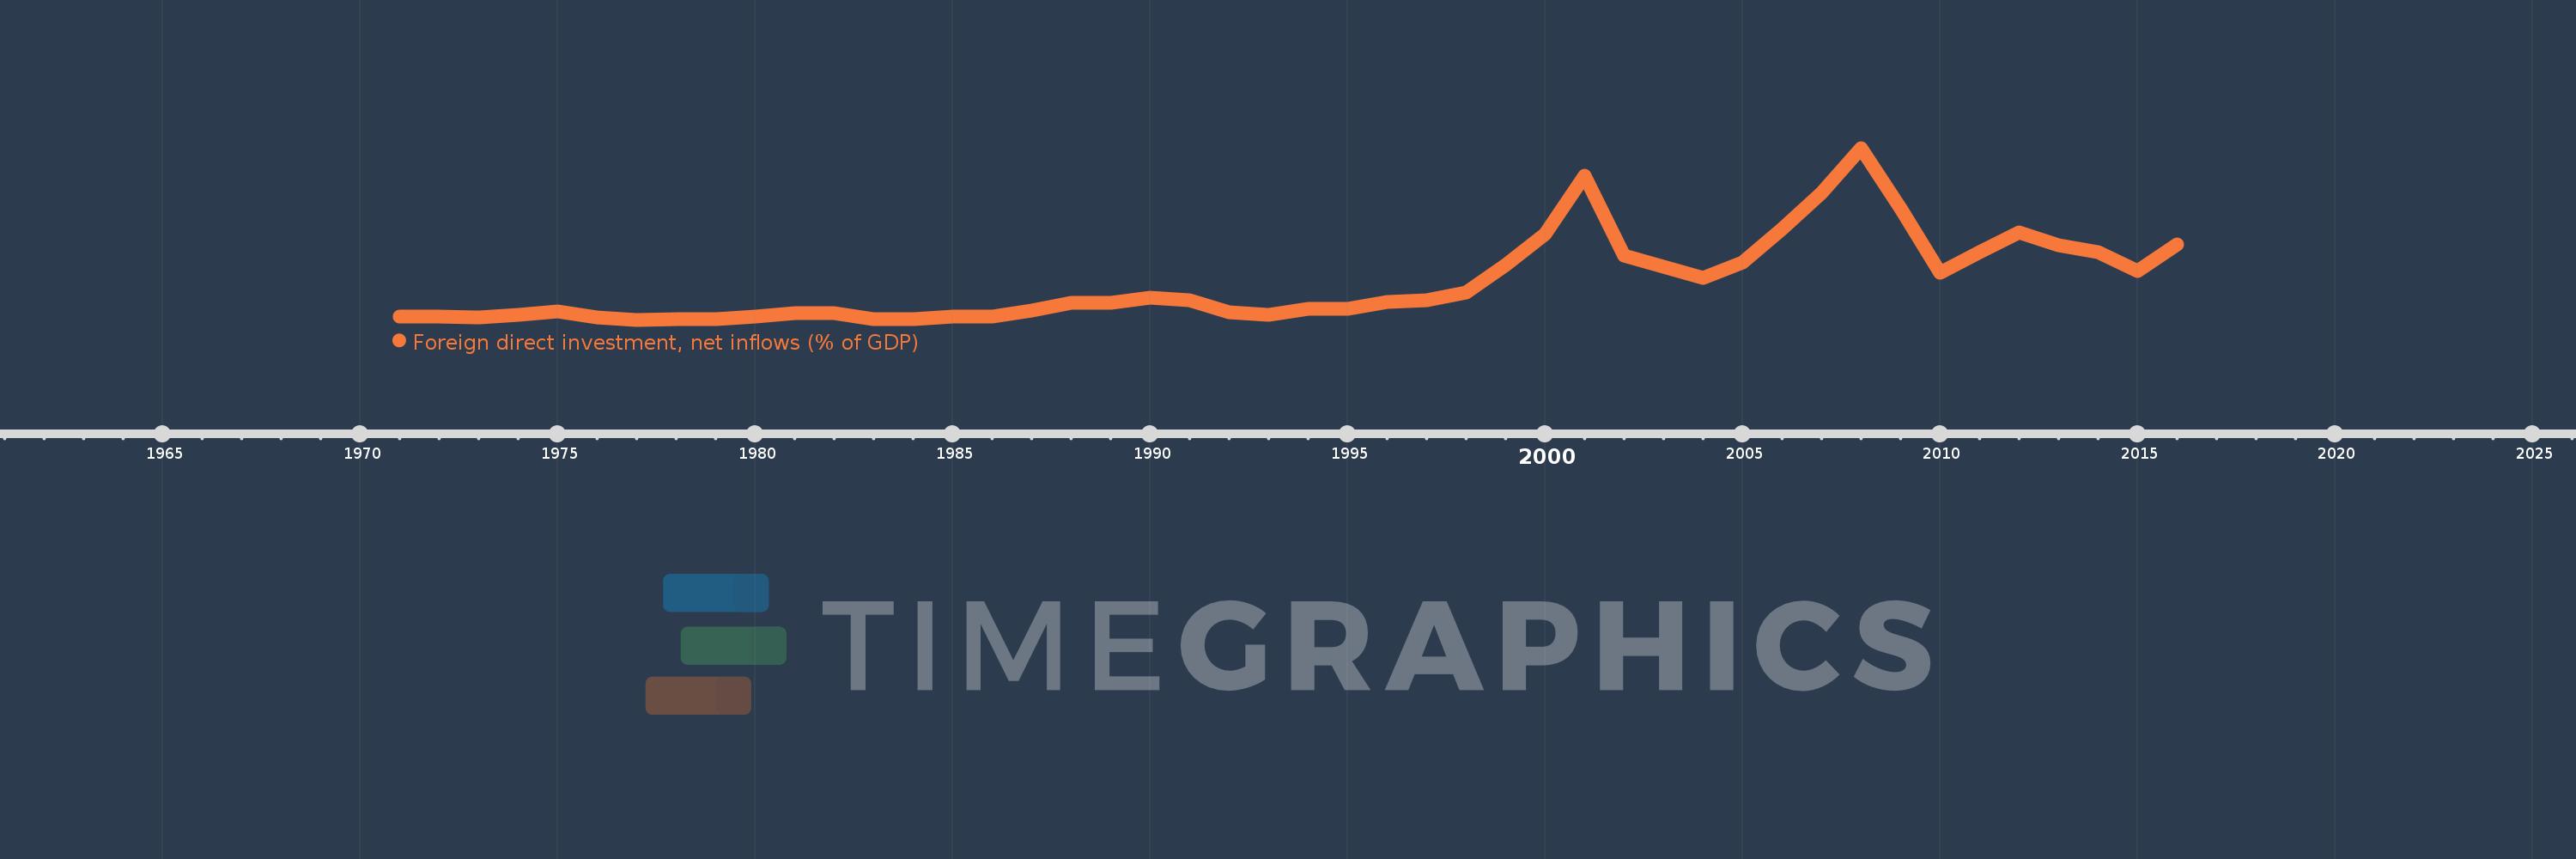
Foreign direct investment, net inflows (% of GDP)
2016,2015,2014,2013,2012,2011,2010,2009,2008,2007,2006,2005,2004,2003,2002,2001,2000,1999,1998,1997,1996,1995,1994,1993,1992,1991,1990,1989,1988,1987,1986,1985,1984,1983,1982,1981,1980,1979,1978,1977,1976,1975,1974,1973,1972,1971
This statistics in other country:
AfghanistanAlbaniaAlgeriaAngolaAntigua and BarbudaArab WorldArgentinaArmeniaArubaAustraliaAustriaAzerbaijanBahamas, TheBahrainBangladeshBarbadosBelarusBelgiumBelizeBeninBermudaBhutanBoliviaBosnia and HerzegovinaBotswanaBrazilBrunei DarussalamBulgariaBurkina FasoBurundiCabo VerdeCambodiaCameroonCanadaCaribbean small statesCayman IslandsCentral African RepublicCentral Europe and the BalticsChadChileChinaColombiaComorosCongo, Dem. Rep.Congo, Rep.Costa RicaCote d'IvoireCroatiaCyprusCzech RepublicDenmarkDjiboutiDominicaDominican RepublicEarly-demographic dividendEast Asia & PacificEast Asia & Pacific (excluding high income)East Asia & Pacific (IDA & IBRD countries)EcuadorEgypt, Arab Rep.El SalvadorEquatorial GuineaEritreaEstoniaEthiopiaEuro areaEurope & Central AsiaEurope & Central Asia (excluding high income)Europe & Central Asia (IDA & IBRD countries)European UnionFijiFinlandFragile and conflict affected situationsFranceFrench PolynesiaGabonGambia, TheGeorgiaGermanyGhanaGreeceGrenadaGuatemalaGuineaGuinea-BissauGuyanaHaitiHeavily indebted poor countries (HIPC)High incomeHondurasHong Kong SAR, ChinaHungaryIBRD onlyIcelandIDA & IBRD totalIDA blendIDA onlyIDA totalIndiaIndonesiaIran, Islamic Rep.IraqIrelandIsraelItalyJamaicaJapanJordanKazakhstanKenyaKiribatiKorea, Rep.KosovoKuwaitKyrgyz RepublicLao PDRLate-demographic dividendLatin America & Caribbean Latin America & Caribbean (excluding high income)Latin America & the Caribbean (IDA & IBRD countries)LatviaLeast developed countries: UN classificationLebanonLesothoLiberiaLibyaLithuaniaLow & middle incomeLow incomeLower middle incomeLuxembourgMacao SAR, ChinaMacedonia, FYRMadagascarMalawiMalaysiaMaldivesMaliMaltaMarshall IslandsMauritaniaMauritiusMexicoMicronesia, Fed. Sts.Middle East & North AfricaMiddle East & North Africa (excluding high income)Middle East & North Africa (IDA & IBRD countries)Middle incomeMoldovaMongoliaMontenegroMoroccoMozambiqueMyanmarNamibiaNauruNepalNetherlandsNew CaledoniaNew ZealandNicaraguaNigerNigeriaNorth AmericaNorwayOECD membersOmanOther small statesPacific island small statesPakistanPalauPanamaPapua New GuineaParaguayPeruPhilippinesPolandPortugalPost-demographic dividendPre-demographic dividendQatarRomaniaRussian FederationRwandaSamoaSao Tome and PrincipeSaudi ArabiaSenegalSerbiaSeychellesSierra LeoneSingaporeSlovak RepublicSloveniaSmall statesSolomon IslandsSomaliaSouth AfricaSouth AsiaSouth Asia (IDA & IBRD)South SudanSpainSri LankaSt. Kitts and NevisSt. LuciaSt. Vincent and the GrenadinesSub-Saharan Africa Sub-Saharan Africa (excluding high income)Sub-Saharan Africa (IDA & IBRD countries)SudanSurinameSwazilandSwedenSwitzerlandSyrian Arab RepublicTajikistanTanzaniaThailandTimor-LesteTogoTongaTrinidad and TobagoTunisiaTurkeyTurkmenistanTuvaluUgandaUkraineUnited Arab EmiratesUnited KingdomUnited StatesUpper middle incomeUruguayUzbekistanVanuatuVenezuela, RBVietnamWest Bank and GazaWorldYemen, Rep.ZambiaZimbabwe Timeline:
This timeline shows a graph from 1971 to 2016 of Post-demographic dividend. No data until 1970. Number of actual observations by date: 46.
Source name:
World Development Indicators
Source organization:
International Monetary Fund, International Financial Statistics and Balance of Payments databases, World Bank, International Debt Statistics, and World Bank and OECD GDP estimates.
Categories, topics:
Economy & Growth, Financial Sector, Climate Change
Last updated:
apr 23, 2017
Indicators value changes by year
At the date of observation
Value
Absolute change
Change from previous value
jan 1, 1971
0.455
+0.455
0.0%
jan 1, 1972
0.449
-0.006
-1.29%
jan 1, 1973
0.429
-0.019
-4.28%
jan 1, 1974
0.496
+0.067
15.57%
jan 1, 1975
0.609
+0.113
22.69%
jan 1, 1976
0.418
-0.191
-31.28%
jan 1, 1977
0.353
-0.065
-15.54%
jan 1, 1978
0.361
+0.008
2.2%
jan 1, 1979
0.376
+0.014
3.98%
jan 1, 1980
0.451
+0.075
20.02%
jan 1, 1981
0.568
+0.117
26.0%
jan 1, 1982
0.558
-0.01
-1.76%
jan 1, 1983
0.373
-0.185
-33.22%
jan 1, 1984
0.373
+0.001
0.24%
jan 1, 1985
0.463
+0.09
23.99%
jan 1, 1986
0.446
-0.017
-3.75%
jan 1, 1987
0.632
+0.186
41.72%
jan 1, 1988
0.877
+0.245
38.8%
jan 1, 1989
0.882
+0.005
0.58%
jan 1, 1990
1.041
+0.159
18.04%
jan 1, 1991
0.953
-0.088
-8.42%
jan 1, 1992
0.593
-0.361
-37.82%
jan 1, 1993
0.517
-0.076
-12.79%
jan 1, 1994
0.692
+0.175
33.83%
jan 1, 1995
0.687
-0.004
-0.64%
jan 1, 1996
0.895
+0.207
30.15%
jan 1, 1997
0.947
+0.053
5.87%
jan 1, 1998
1.189
+0.242
25.52%
jan 1, 1999
2.052
+0.863
72.6%
jan 1, 2000
2.992
+0.94
45.8%
jan 1, 2001
4.806
+1.815
60.65%
jan 1, 2002
2.34
-2.466
-51.31%
jan 1, 2003
1.988
-0.352
-15.06%
jan 1, 2004
1.645
-0.343
-17.26%
jan 1, 2005
2.131
+0.487
29.58%
jan 1, 2006
3.15
+1.019
47.81%
jan 1, 2007
4.258
+1.108
35.18%
jan 1, 2008
5.653
+1.394
32.74%
jan 1, 2009
3.781
-1.872
-33.12%
jan 1, 2010
1.813
-1.967
-52.04%
jan 1, 2011
2.447
+0.633
34.93%
jan 1, 2012
3.041
+0.594
24.28%
jan 1, 2013
2.64
-0.401
-13.18%
jan 1, 2014
2.433
-0.207
-7.85%
jan 1, 2015
1.853
-0.58
-23.84%
jan 1, 2016
2.677
+0.824
44.48%
Ranking of countries by current statistics by years


Comments: