29
/
en
AIzaSyAYiBZKx7MnpbEhh9jyipgxe19OcubqV5w
April 1, 2024
159391
Ireland
IRL
true
2
1
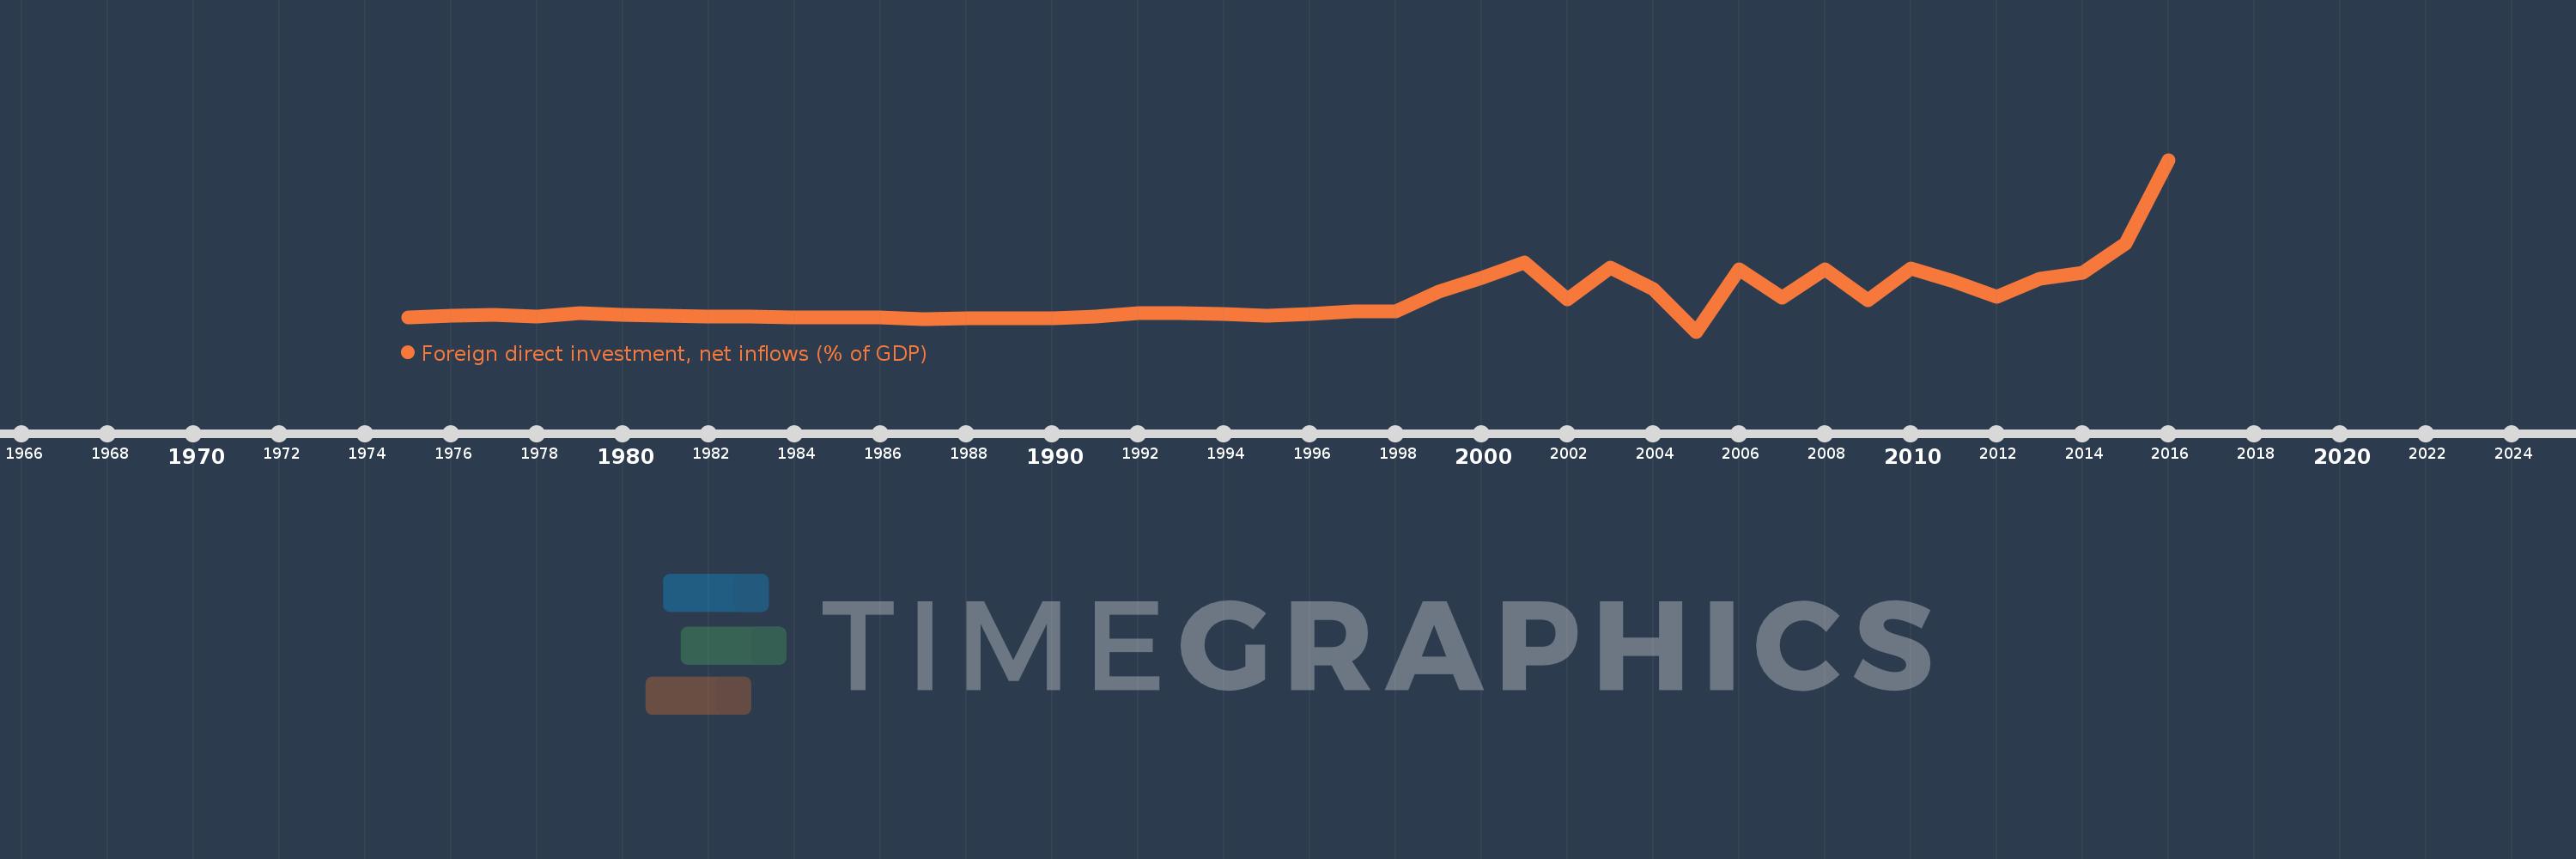
Foreign direct investment, net inflows (% of GDP)
2016,2015,2014,2013,2012,2011,2010,2009,2008,2007,2006,2005,2004,2003,2002,2001,2000,1999,1998,1997,1996,1995,1994,1993,1992,1991,1990,1989,1988,1987,1986,1985,1984,1983,1982,1981,1980,1979,1978,1977,1976,1975
This statistics in other country:
AfghanistanAlbaniaAlgeriaAngolaAntigua and BarbudaArab WorldArgentinaArmeniaArubaAustraliaAustriaAzerbaijanBahamas, TheBahrainBangladeshBarbadosBelarusBelgiumBelizeBeninBermudaBhutanBoliviaBosnia and HerzegovinaBotswanaBrazilBrunei DarussalamBulgariaBurkina FasoBurundiCabo VerdeCambodiaCameroonCanadaCaribbean small statesCayman IslandsCentral African RepublicCentral Europe and the BalticsChadChileChinaColombiaComorosCongo, Dem. Rep.Congo, Rep.Costa RicaCote d'IvoireCroatiaCyprusCzech RepublicDenmarkDjiboutiDominicaDominican RepublicEarly-demographic dividendEast Asia & PacificEast Asia & Pacific (excluding high income)East Asia & Pacific (IDA & IBRD countries)EcuadorEgypt, Arab Rep.El SalvadorEquatorial GuineaEritreaEstoniaEthiopiaEuro areaEurope & Central AsiaEurope & Central Asia (excluding high income)Europe & Central Asia (IDA & IBRD countries)European UnionFijiFinlandFragile and conflict affected situationsFranceFrench PolynesiaGabonGambia, TheGeorgiaGermanyGhanaGreeceGrenadaGuatemalaGuineaGuinea-BissauGuyanaHaitiHeavily indebted poor countries (HIPC)High incomeHondurasHong Kong SAR, ChinaHungaryIBRD onlyIcelandIDA & IBRD totalIDA blendIDA onlyIDA totalIndiaIndonesiaIran, Islamic Rep.IraqIrelandIsraelItalyJamaicaJapanJordanKazakhstanKenyaKiribatiKorea, Rep.KosovoKuwaitKyrgyz RepublicLao PDRLate-demographic dividendLatin America & Caribbean Latin America & Caribbean (excluding high income)Latin America & the Caribbean (IDA & IBRD countries)LatviaLeast developed countries: UN classificationLebanonLesothoLiberiaLibyaLithuaniaLow & middle incomeLow incomeLower middle incomeLuxembourgMacao SAR, ChinaMacedonia, FYRMadagascarMalawiMalaysiaMaldivesMaliMaltaMarshall IslandsMauritaniaMauritiusMexicoMicronesia, Fed. Sts.Middle East & North AfricaMiddle East & North Africa (excluding high income)Middle East & North Africa (IDA & IBRD countries)Middle incomeMoldovaMongoliaMontenegroMoroccoMozambiqueMyanmarNamibiaNauruNepalNetherlandsNew CaledoniaNew ZealandNicaraguaNigerNigeriaNorth AmericaNorwayOECD membersOmanOther small statesPacific island small statesPakistanPalauPanamaPapua New GuineaParaguayPeruPhilippinesPolandPortugalPost-demographic dividendPre-demographic dividendQatarRomaniaRussian FederationRwandaSamoaSao Tome and PrincipeSaudi ArabiaSenegalSerbiaSeychellesSierra LeoneSingaporeSlovak RepublicSloveniaSmall statesSolomon IslandsSomaliaSouth AfricaSouth AsiaSouth Asia (IDA & IBRD)South SudanSpainSri LankaSt. Kitts and NevisSt. LuciaSt. Vincent and the GrenadinesSub-Saharan Africa Sub-Saharan Africa (excluding high income)Sub-Saharan Africa (IDA & IBRD countries)SudanSurinameSwazilandSwedenSwitzerlandSyrian Arab RepublicTajikistanTanzaniaThailandTimor-LesteTogoTongaTrinidad and TobagoTunisiaTurkeyTurkmenistanTuvaluUgandaUkraineUnited Arab EmiratesUnited KingdomUnited StatesUpper middle incomeUruguayUzbekistanVanuatuVenezuela, RBVietnamWest Bank and GazaWorldYemen, Rep.ZambiaZimbabwe Timeline:
This timeline shows a graph from 1975 to 2016 of Ireland. No data until 1974. Number of actual observations by date: 42.
Source name:
World Development Indicators
Source organization:
International Monetary Fund, International Financial Statistics and Balance of Payments databases, World Bank, International Debt Statistics, and World Bank and OECD GDP estimates.
Categories, topics:
Economy & Growth, Financial Sector, Climate Change
Last updated:
apr 23, 2017
Indicators value changes by year
Minimum:
-5.671
jan 1, 2005
Maximum:
71.717
jan 1, 2016
At the date of observation
Value
Absolute change
Change from previous value
jan 1, 1975
0.648
+0.648
0.0%
jan 1, 1976
1.666
+1.018
157.25%
jan 1, 1977
1.825
+0.159
9.52%
jan 1, 1978
1.21
-0.615
-33.69%
jan 1, 1979
2.559
+1.349
111.52%
jan 1, 1980
1.836
-0.723
-28.26%
jan 1, 1981
1.316
-0.52
-28.33%
jan 1, 1982
0.983
-0.333
-25.27%
jan 1, 1983
1.126
+0.143
14.5%
jan 1, 1984
0.816
-0.31
-27.51%
jan 1, 1985
0.603
-0.213
-26.12%
jan 1, 1986
0.769
+0.166
27.48%
jan 1, 1987
-0.141
-0.909
-118.28%
jan 1, 1988
0.263
+0.403
-287.01%
jan 1, 1989
0.242
-0.021
-7.89%
jan 1, 1990
0.217
-0.025
-10.51%
jan 1, 1991
1.271
+1.055
486.81%
jan 1, 1992
2.722
+1.451
114.15%
jan 1, 1993
2.576
-0.147
-5.39%
jan 1, 1994
2.137
-0.439
-17.04%
jan 1, 1995
1.467
-0.67
-31.36%
jan 1, 1996
2.09
+0.623
42.5%
jan 1, 1997
3.451
+1.361
65.1%
jan 1, 1998
3.312
-0.139
-4.02%
jan 1, 1999
12.246
+8.934
269.74%
jan 1, 2000
18.549
+6.303
51.47%
jan 1, 2001
25.538
+6.989
37.68%
jan 1, 2002
8.773
-16.765
-65.65%
jan 1, 2003
23.04
+14.267
162.63%
jan 1, 2004
13.641
-9.398
-40.79%
jan 1, 2005
-5.671
-19.312
-141.57%
jan 1, 2006
22.216
+27.887
-491.76%
jan 1, 2007
9.511
-12.705
-57.19%
jan 1, 2008
22.197
+12.686
133.39%
jan 1, 2009
8.46
-13.737
-61.89%
jan 1, 2010
22.877
+14.416
170.4%
jan 1, 2011
17.06
-5.817
-25.43%
jan 1, 2012
9.837
-7.223
-42.34%
jan 1, 2013
18.139
+8.302
84.4%
jan 1, 2014
20.88
+2.741
15.11%
jan 1, 2015
33.857
+12.977
62.15%
jan 1, 2016
71.717
+37.86
111.82%
Ranking of countries by current statistics by years


Comments: