29
/
en
AIzaSyAYiBZKx7MnpbEhh9jyipgxe19OcubqV5w
April 1, 2024
68781
Antigua and Barbuda
ATG
true
2
1
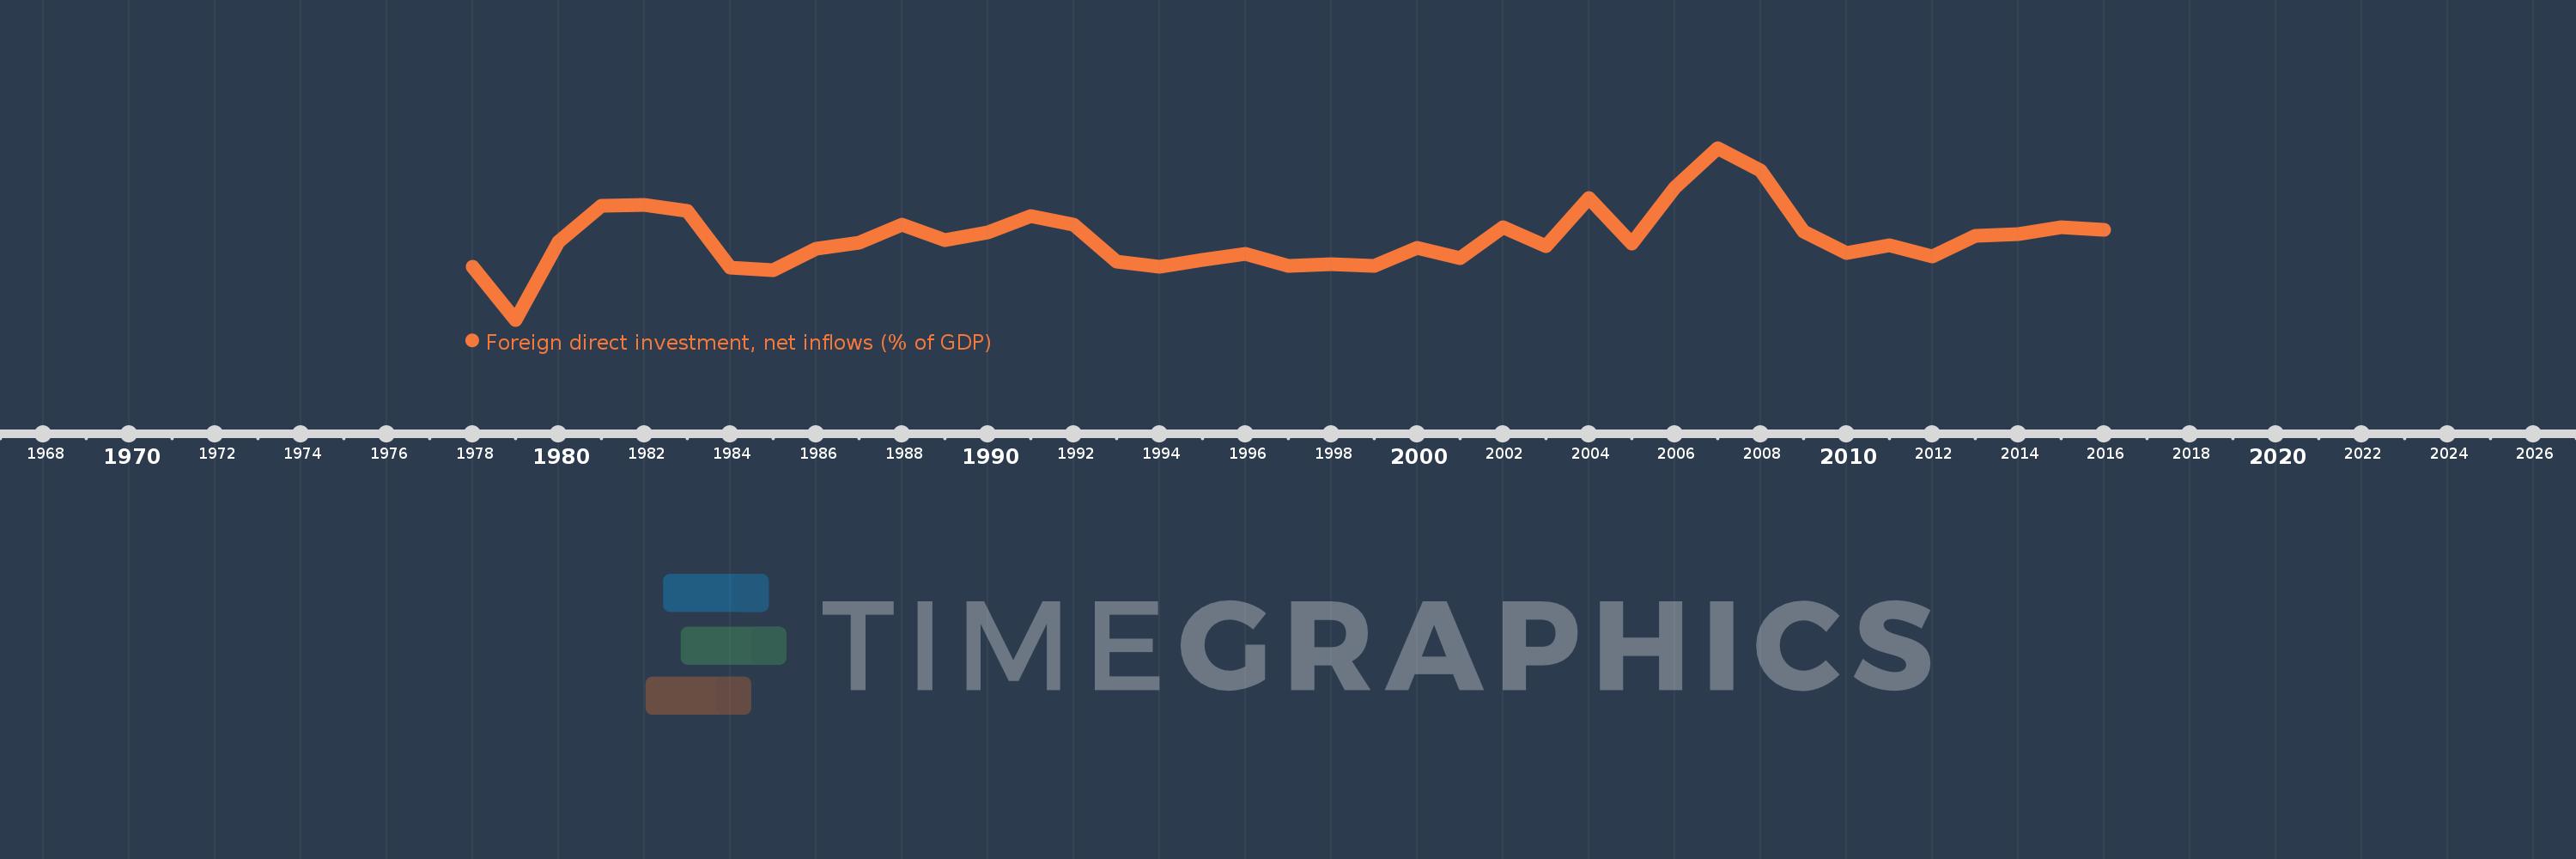
Foreign direct investment, net inflows (% of GDP)
2016,2015,2014,2013,2012,2011,2010,2009,2008,2007,2006,2005,2004,2003,2002,2001,2000,1999,1998,1997,1996,1995,1994,1993,1992,1991,1990,1989,1988,1987,1986,1985,1984,1983,1982,1981,1980,1979,1978
This statistics in other country:
AfghanistanAlbaniaAlgeriaAngolaAntigua and BarbudaArab WorldArgentinaArmeniaArubaAustraliaAustriaAzerbaijanBahamas, TheBahrainBangladeshBarbadosBelarusBelgiumBelizeBeninBermudaBhutanBoliviaBosnia and HerzegovinaBotswanaBrazilBrunei DarussalamBulgariaBurkina FasoBurundiCabo VerdeCambodiaCameroonCanadaCaribbean small statesCayman IslandsCentral African RepublicCentral Europe and the BalticsChadChileChinaColombiaComorosCongo, Dem. Rep.Congo, Rep.Costa RicaCote d'IvoireCroatiaCyprusCzech RepublicDenmarkDjiboutiDominicaDominican RepublicEarly-demographic dividendEast Asia & PacificEast Asia & Pacific (excluding high income)East Asia & Pacific (IDA & IBRD countries)EcuadorEgypt, Arab Rep.El SalvadorEquatorial GuineaEritreaEstoniaEthiopiaEuro areaEurope & Central AsiaEurope & Central Asia (excluding high income)Europe & Central Asia (IDA & IBRD countries)European UnionFijiFinlandFragile and conflict affected situationsFranceFrench PolynesiaGabonGambia, TheGeorgiaGermanyGhanaGreeceGrenadaGuatemalaGuineaGuinea-BissauGuyanaHaitiHeavily indebted poor countries (HIPC)High incomeHondurasHong Kong SAR, ChinaHungaryIBRD onlyIcelandIDA & IBRD totalIDA blendIDA onlyIDA totalIndiaIndonesiaIran, Islamic Rep.IraqIrelandIsraelItalyJamaicaJapanJordanKazakhstanKenyaKiribatiKorea, Rep.KosovoKuwaitKyrgyz RepublicLao PDRLate-demographic dividendLatin America & Caribbean Latin America & Caribbean (excluding high income)Latin America & the Caribbean (IDA & IBRD countries)LatviaLeast developed countries: UN classificationLebanonLesothoLiberiaLibyaLithuaniaLow & middle incomeLow incomeLower middle incomeLuxembourgMacao SAR, ChinaMacedonia, FYRMadagascarMalawiMalaysiaMaldivesMaliMaltaMarshall IslandsMauritaniaMauritiusMexicoMicronesia, Fed. Sts.Middle East & North AfricaMiddle East & North Africa (excluding high income)Middle East & North Africa (IDA & IBRD countries)Middle incomeMoldovaMongoliaMontenegroMoroccoMozambiqueMyanmarNamibiaNauruNepalNetherlandsNew CaledoniaNew ZealandNicaraguaNigerNigeriaNorth AmericaNorwayOECD membersOmanOther small statesPacific island small statesPakistanPalauPanamaPapua New GuineaParaguayPeruPhilippinesPolandPortugalPost-demographic dividendPre-demographic dividendQatarRomaniaRussian FederationRwandaSamoaSao Tome and PrincipeSaudi ArabiaSenegalSerbiaSeychellesSierra LeoneSingaporeSlovak RepublicSloveniaSmall statesSolomon IslandsSomaliaSouth AfricaSouth AsiaSouth Asia (IDA & IBRD)South SudanSpainSri LankaSt. Kitts and NevisSt. LuciaSt. Vincent and the GrenadinesSub-Saharan Africa Sub-Saharan Africa (excluding high income)Sub-Saharan Africa (IDA & IBRD countries)SudanSurinameSwazilandSwedenSwitzerlandSyrian Arab RepublicTajikistanTanzaniaThailandTimor-LesteTogoTongaTrinidad and TobagoTunisiaTurkeyTurkmenistanTuvaluUgandaUkraineUnited Arab EmiratesUnited KingdomUnited StatesUpper middle incomeUruguayUzbekistanVanuatuVenezuela, RBVietnamWest Bank and GazaWorldYemen, Rep.ZambiaZimbabwe Timeline:
This timeline shows a graph from 1978 to 2016 of Antigua and Barbuda. No data until 1977. Number of actual observations by date: 39.
Source name:
World Development Indicators
Source organization:
International Monetary Fund, International Financial Statistics and Balance of Payments databases, World Bank, International Debt Statistics, and World Bank and OECD GDP estimates.
Categories, topics:
Economy & Growth, Financial Sector, Climate Change
Last updated:
apr 23, 2017
Indicators value changes by year
Minimum:
-9.218
jan 1, 1979
At the date of observation
Value
Absolute change
Change from previous value
jan 1, 1978
3.326
+3.326
0.0%
jan 1, 1979
-9.218
-12.544
-377.14%
jan 1, 1980
9.215
+18.433
-199.97%
jan 1, 1981
17.807
+8.592
93.24%
jan 1, 1982
17.997
+0.19
1.07%
jan 1, 1983
16.672
-1.325
-7.36%
jan 1, 1984
3.262
-13.41
-80.43%
jan 1, 1985
2.536
-0.726
-22.27%
jan 1, 1986
7.728
+5.192
204.75%
jan 1, 1987
9.191
+1.463
18.93%
jan 1, 1988
13.473
+4.282
46.59%
jan 1, 1989
9.729
-3.744
-27.79%
jan 1, 1990
11.544
+1.815
18.66%
jan 1, 1991
15.478
+3.934
34.07%
jan 1, 1992
13.351
-2.127
-13.74%
jan 1, 1993
4.637
-8.715
-65.27%
jan 1, 1994
3.338
-1.298
-28.0%
jan 1, 1995
4.957
+1.619
48.48%
jan 1, 1996
6.371
+1.414
28.53%
jan 1, 1997
3.577
-2.795
-43.86%
jan 1, 1998
3.957
+0.38
10.64%
jan 1, 1999
3.673
-0.284
-7.18%
jan 1, 2000
7.945
+4.272
116.32%
jan 1, 2001
5.501
-2.445
-30.77%
jan 1, 2002
12.724
+7.223
131.32%
jan 1, 2003
8.207
-4.517
-35.5%
jan 1, 2004
19.8
+11.593
141.25%
jan 1, 2005
8.946
-10.854
-54.82%
jan 1, 2006
22.155
+13.209
147.65%
jan 1, 2007
31.61
+9.456
42.68%
jan 1, 2008
26.233
-5.378
-17.01%
jan 1, 2009
11.785
-14.448
-55.08%
jan 1, 2010
6.685
-5.1
-43.28%
jan 1, 2011
8.514
+1.829
27.36%
jan 1, 2012
5.767
-2.747
-32.27%
jan 1, 2013
10.738
+4.972
86.21%
jan 1, 2014
11.185
+0.447
4.16%
jan 1, 2015
12.676
+1.491
13.33%
jan 1, 2016
12.234
-0.442
-3.49%
Ranking of countries by current statistics by years


Comments: