29
/
en
AIzaSyAYiBZKx7MnpbEhh9jyipgxe19OcubqV5w
April 1, 2024
47115
Lower middle income
LMC
false
2
1
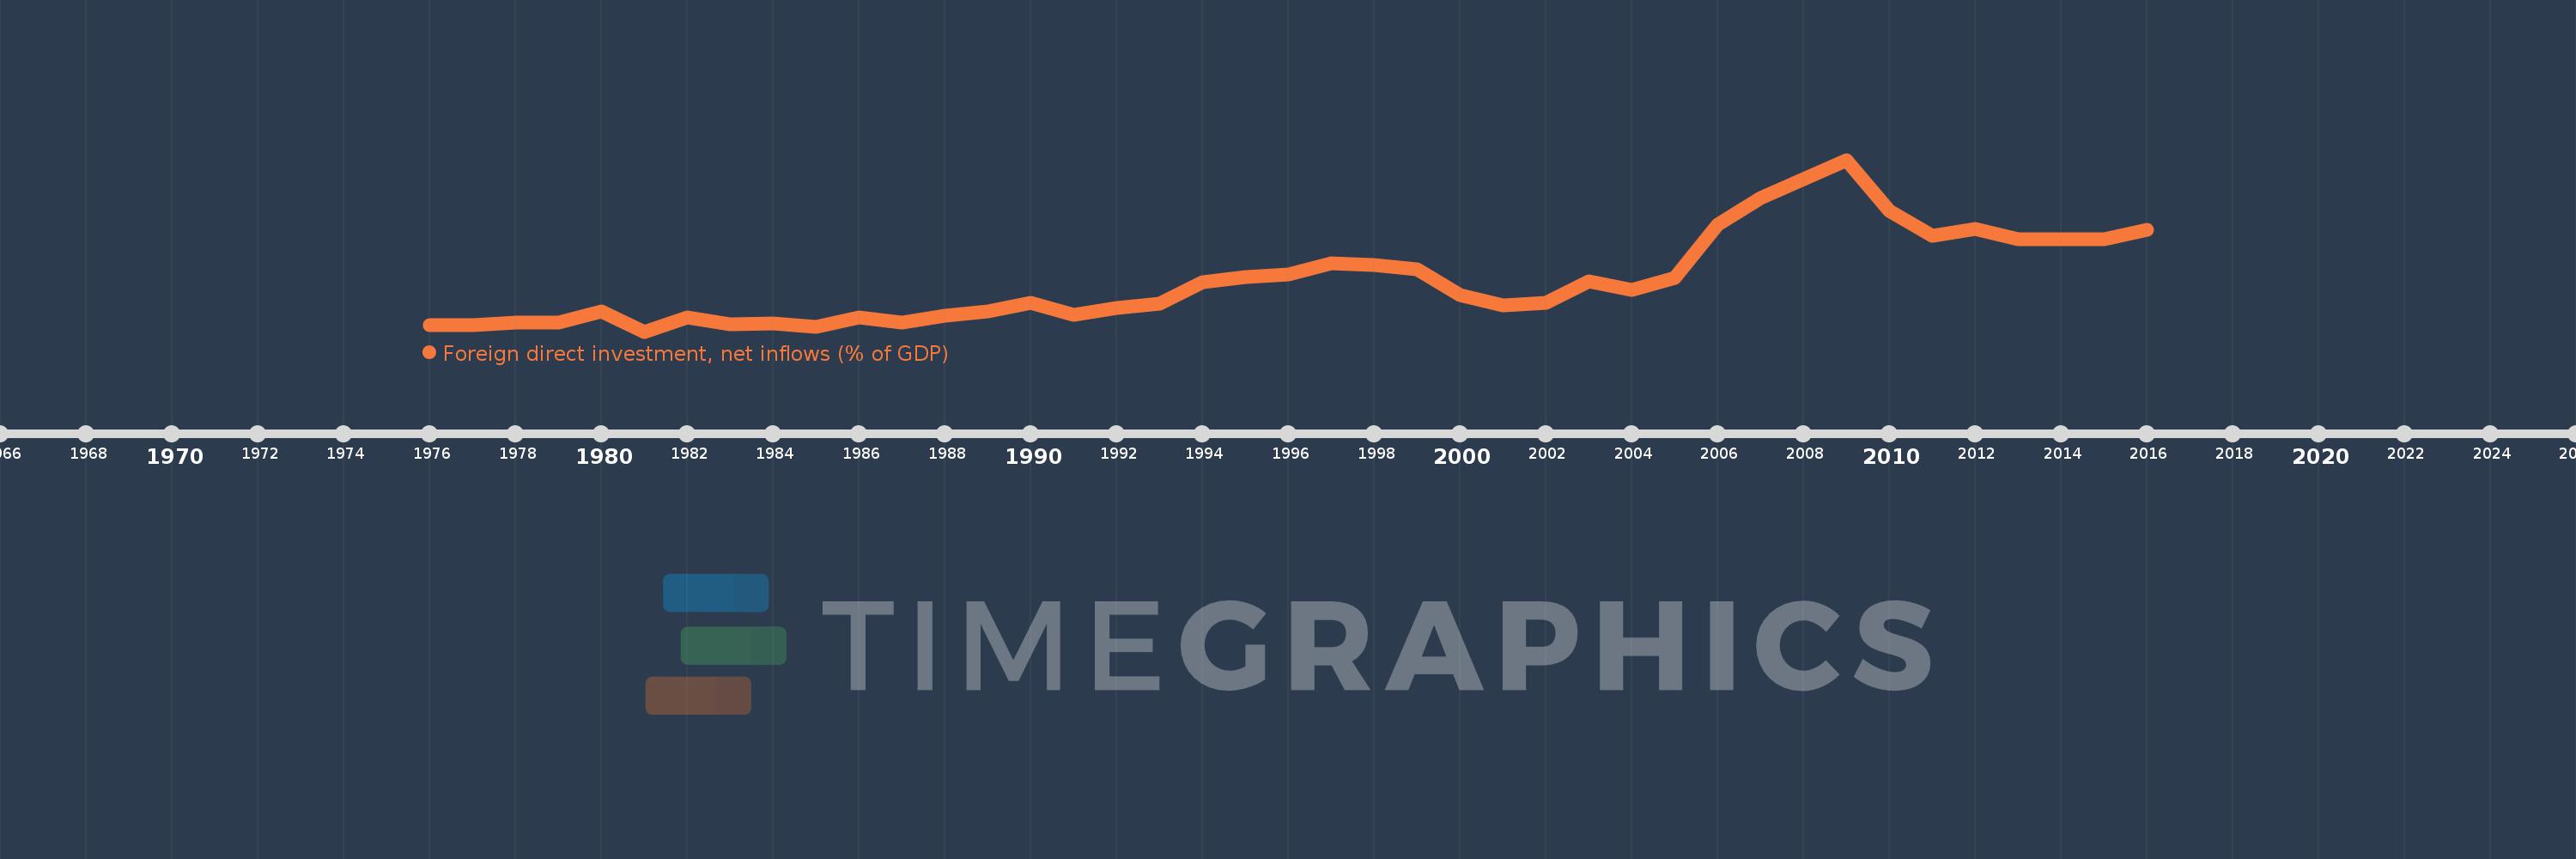
Foreign direct investment, net inflows (% of GDP)
2016,2015,2014,2013,2012,2011,2010,2009,2008,2007,2006,2005,2004,2003,2002,2001,2000,1999,1998,1997,1996,1995,1994,1993,1992,1991,1990,1989,1988,1987,1986,1985,1984,1983,1982,1981,1980,1979,1978,1977,1976
This statistics in other country:
AfghanistanAlbaniaAlgeriaAngolaAntigua and BarbudaArab WorldArgentinaArmeniaArubaAustraliaAustriaAzerbaijanBahamas, TheBahrainBangladeshBarbadosBelarusBelgiumBelizeBeninBermudaBhutanBoliviaBosnia and HerzegovinaBotswanaBrazilBrunei DarussalamBulgariaBurkina FasoBurundiCabo VerdeCambodiaCameroonCanadaCaribbean small statesCayman IslandsCentral African RepublicCentral Europe and the BalticsChadChileChinaColombiaComorosCongo, Dem. Rep.Congo, Rep.Costa RicaCote d'IvoireCroatiaCyprusCzech RepublicDenmarkDjiboutiDominicaDominican RepublicEarly-demographic dividendEast Asia & PacificEast Asia & Pacific (excluding high income)East Asia & Pacific (IDA & IBRD countries)EcuadorEgypt, Arab Rep.El SalvadorEquatorial GuineaEritreaEstoniaEthiopiaEuro areaEurope & Central AsiaEurope & Central Asia (excluding high income)Europe & Central Asia (IDA & IBRD countries)European UnionFijiFinlandFragile and conflict affected situationsFranceFrench PolynesiaGabonGambia, TheGeorgiaGermanyGhanaGreeceGrenadaGuatemalaGuineaGuinea-BissauGuyanaHaitiHeavily indebted poor countries (HIPC)High incomeHondurasHong Kong SAR, ChinaHungaryIBRD onlyIcelandIDA & IBRD totalIDA blendIDA onlyIDA totalIndiaIndonesiaIran, Islamic Rep.IraqIrelandIsraelItalyJamaicaJapanJordanKazakhstanKenyaKiribatiKorea, Rep.KosovoKuwaitKyrgyz RepublicLao PDRLate-demographic dividendLatin America & Caribbean Latin America & Caribbean (excluding high income)Latin America & the Caribbean (IDA & IBRD countries)LatviaLeast developed countries: UN classificationLebanonLesothoLiberiaLibyaLithuaniaLow & middle incomeLow incomeLower middle incomeLuxembourgMacao SAR, ChinaMacedonia, FYRMadagascarMalawiMalaysiaMaldivesMaliMaltaMarshall IslandsMauritaniaMauritiusMexicoMicronesia, Fed. Sts.Middle East & North AfricaMiddle East & North Africa (excluding high income)Middle East & North Africa (IDA & IBRD countries)Middle incomeMoldovaMongoliaMontenegroMoroccoMozambiqueMyanmarNamibiaNauruNepalNetherlandsNew CaledoniaNew ZealandNicaraguaNigerNigeriaNorth AmericaNorwayOECD membersOmanOther small statesPacific island small statesPakistanPalauPanamaPapua New GuineaParaguayPeruPhilippinesPolandPortugalPost-demographic dividendPre-demographic dividendQatarRomaniaRussian FederationRwandaSamoaSao Tome and PrincipeSaudi ArabiaSenegalSerbiaSeychellesSierra LeoneSingaporeSlovak RepublicSloveniaSmall statesSolomon IslandsSomaliaSouth AfricaSouth AsiaSouth Asia (IDA & IBRD)South SudanSpainSri LankaSt. Kitts and NevisSt. LuciaSt. Vincent and the GrenadinesSub-Saharan Africa Sub-Saharan Africa (excluding high income)Sub-Saharan Africa (IDA & IBRD countries)SudanSurinameSwazilandSwedenSwitzerlandSyrian Arab RepublicTajikistanTanzaniaThailandTimor-LesteTogoTongaTrinidad and TobagoTunisiaTurkeyTurkmenistanTuvaluUgandaUkraineUnited Arab EmiratesUnited KingdomUnited StatesUpper middle incomeUruguayUzbekistanVanuatuVenezuela, RBVietnamWest Bank and GazaWorldYemen, Rep.ZambiaZimbabwe Timeline:
This timeline shows a graph from 1976 to 2016 of Lower middle income. No data until 1975. Number of actual observations by date: 41.
Source name:
World Development Indicators
Source organization:
International Monetary Fund, International Financial Statistics and Balance of Payments databases, World Bank, International Debt Statistics, and World Bank and OECD GDP estimates.
Categories, topics:
Economy & Growth, Financial Sector, Climate Change
Last updated:
apr 23, 2017
Indicators value changes by year
At the date of observation
Value
Absolute change
Change from previous value
jan 1, 1976
0.356
+0.356
0.0%
jan 1, 1977
0.342
-0.014
-3.99%
jan 1, 1978
0.4
+0.058
17.05%
jan 1, 1979
0.394
-0.006
-1.55%
jan 1, 1980
0.624
+0.23
58.28%
jan 1, 1981
0.219
-0.405
-64.93%
jan 1, 1982
0.499
+0.28
128.19%
jan 1, 1983
0.372
-0.127
-25.49%
jan 1, 1984
0.388
+0.016
4.34%
jan 1, 1985
0.316
-0.072
-18.65%
jan 1, 1986
0.505
+0.19
60.15%
jan 1, 1987
0.393
-0.113
-22.3%
jan 1, 1988
0.532
+0.139
35.48%
jan 1, 1989
0.625
+0.093
17.51%
jan 1, 1990
0.802
+0.177
28.24%
jan 1, 1991
0.559
-0.243
-30.24%
jan 1, 1992
0.687
+0.128
22.84%
jan 1, 1993
0.775
+0.088
12.83%
jan 1, 1994
1.216
+0.441
56.86%
jan 1, 1995
1.312
+0.096
7.89%
jan 1, 1996
1.369
+0.057
4.35%
jan 1, 1997
1.588
+0.219
15.97%
jan 1, 1998
1.561
-0.027
-1.71%
jan 1, 1999
1.46
-0.101
-6.46%
jan 1, 2000
0.95
-0.51
-34.92%
jan 1, 2001
0.74
-0.21
-22.15%
jan 1, 2002
0.788
+0.048
6.51%
jan 1, 2003
1.218
+0.43
54.62%
jan 1, 2004
1.055
-0.163
-13.35%
jan 1, 2005
1.288
+0.233
22.07%
jan 1, 2006
2.36
+1.072
83.22%
jan 1, 2007
2.892
+0.532
22.54%
jan 1, 2008
3.269
+0.377
13.02%
jan 1, 2009
3.663
+0.395
12.07%
jan 1, 2010
2.645
-1.018
-27.79%
jan 1, 2011
2.138
-0.507
-19.16%
jan 1, 2012
2.273
+0.135
6.3%
jan 1, 2013
2.065
-0.209
-9.18%
jan 1, 2014
2.075
+0.01
0.49%
jan 1, 2015
2.078
+0.003
0.13%
jan 1, 2016
2.264
+0.187
8.98%
Ranking of countries by current statistics by years


Comments: