29
/
en
AIzaSyAYiBZKx7MnpbEhh9jyipgxe19OcubqV5w
April 1, 2024
146823
Guinea-Bissau
GNB
true
2
1
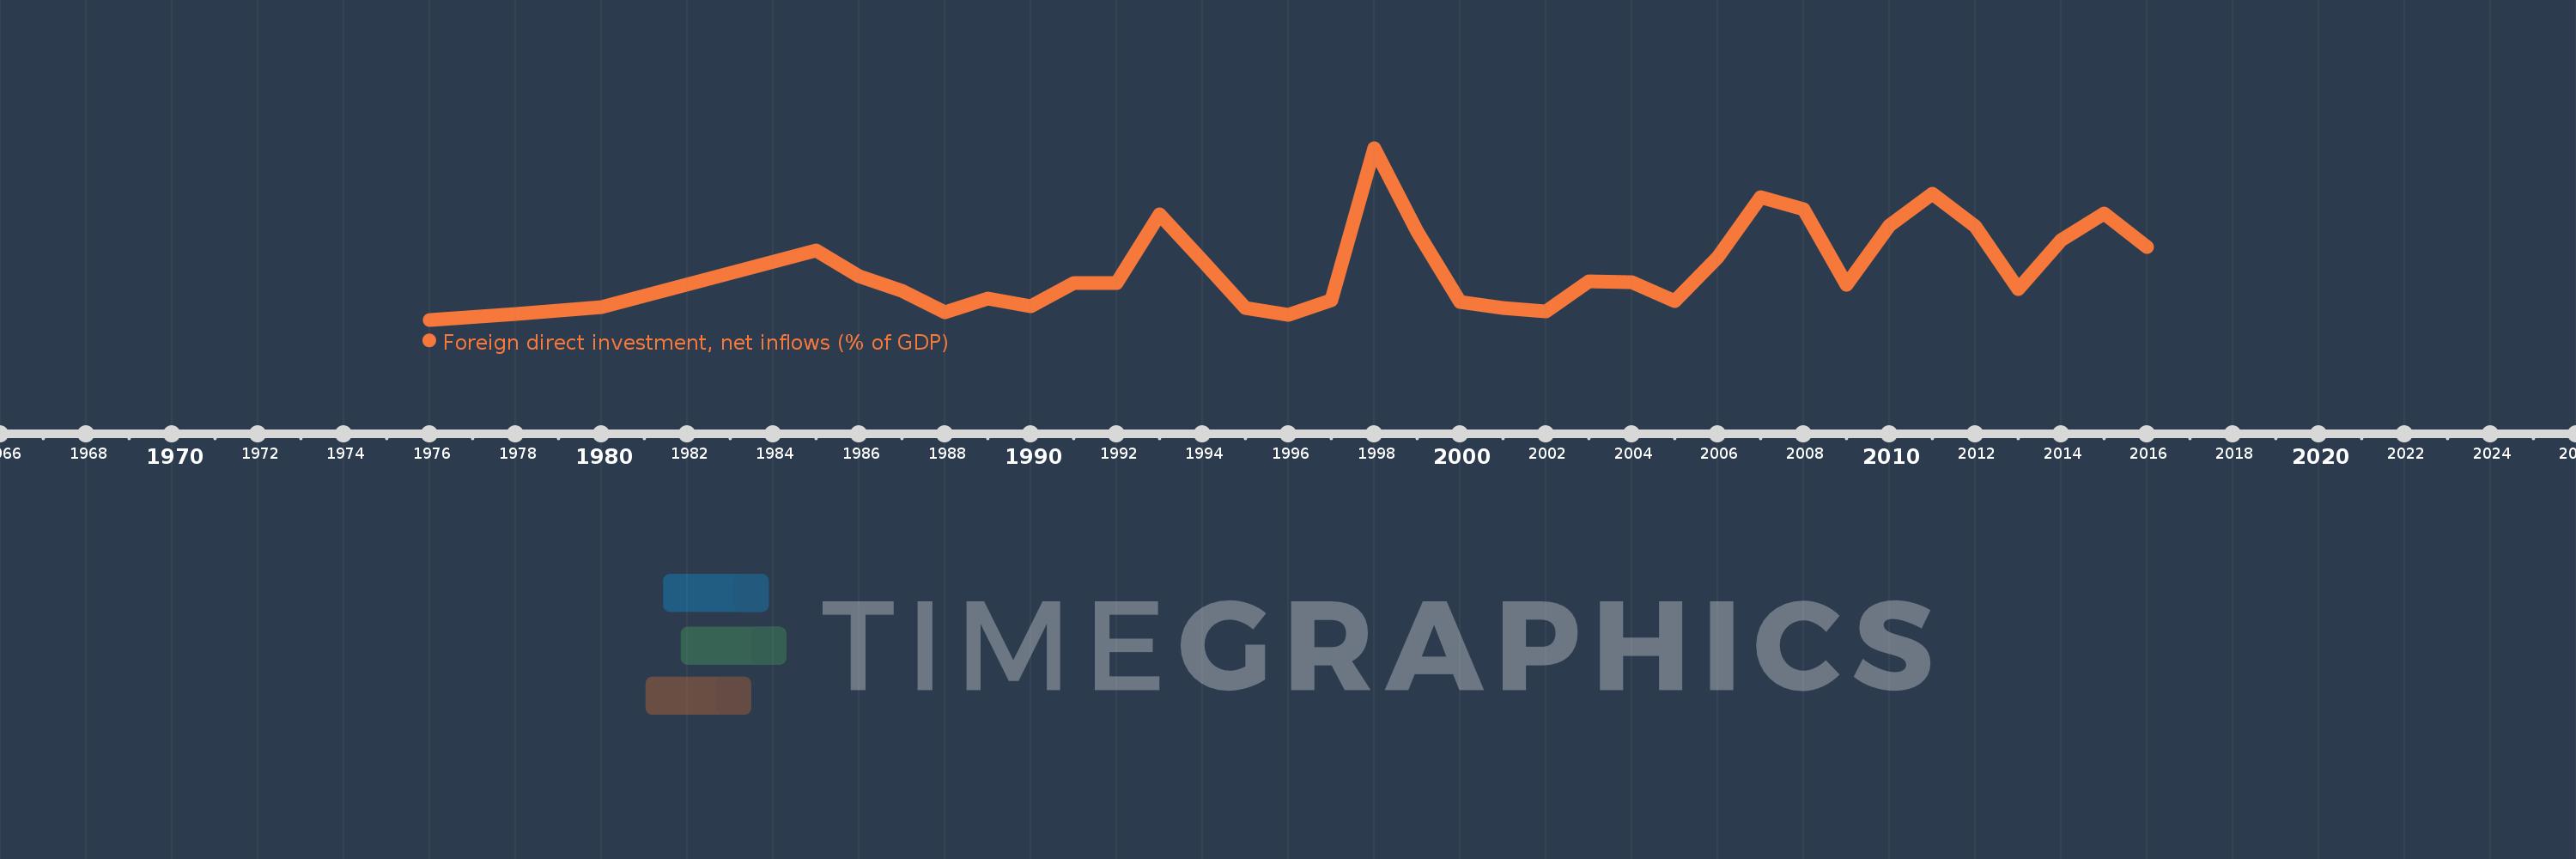
Foreign direct investment, net inflows (% of GDP)
2016,2015,2014,2013,2012,2011,2010,2009,2008,2007,2006,2005,2004,2003,2002,2001,2000,1999,1998,1997,1996,1995,1994,1993,1992,1991,1990,1989,1988,1987,1986,1985,1980,1978,1976
This statistics in other country:
AfghanistanAlbaniaAlgeriaAngolaAntigua and BarbudaArab WorldArgentinaArmeniaArubaAustraliaAustriaAzerbaijanBahamas, TheBahrainBangladeshBarbadosBelarusBelgiumBelizeBeninBermudaBhutanBoliviaBosnia and HerzegovinaBotswanaBrazilBrunei DarussalamBulgariaBurkina FasoBurundiCabo VerdeCambodiaCameroonCanadaCaribbean small statesCayman IslandsCentral African RepublicCentral Europe and the BalticsChadChileChinaColombiaComorosCongo, Dem. Rep.Congo, Rep.Costa RicaCote d'IvoireCroatiaCyprusCzech RepublicDenmarkDjiboutiDominicaDominican RepublicEarly-demographic dividendEast Asia & PacificEast Asia & Pacific (excluding high income)East Asia & Pacific (IDA & IBRD countries)EcuadorEgypt, Arab Rep.El SalvadorEquatorial GuineaEritreaEstoniaEthiopiaEuro areaEurope & Central AsiaEurope & Central Asia (excluding high income)Europe & Central Asia (IDA & IBRD countries)European UnionFijiFinlandFragile and conflict affected situationsFranceFrench PolynesiaGabonGambia, TheGeorgiaGermanyGhanaGreeceGrenadaGuatemalaGuineaGuinea-BissauGuyanaHaitiHeavily indebted poor countries (HIPC)High incomeHondurasHong Kong SAR, ChinaHungaryIBRD onlyIcelandIDA & IBRD totalIDA blendIDA onlyIDA totalIndiaIndonesiaIran, Islamic Rep.IraqIrelandIsraelItalyJamaicaJapanJordanKazakhstanKenyaKiribatiKorea, Rep.KosovoKuwaitKyrgyz RepublicLao PDRLate-demographic dividendLatin America & Caribbean Latin America & Caribbean (excluding high income)Latin America & the Caribbean (IDA & IBRD countries)LatviaLeast developed countries: UN classificationLebanonLesothoLiberiaLibyaLithuaniaLow & middle incomeLow incomeLower middle incomeLuxembourgMacao SAR, ChinaMacedonia, FYRMadagascarMalawiMalaysiaMaldivesMaliMaltaMarshall IslandsMauritaniaMauritiusMexicoMicronesia, Fed. Sts.Middle East & North AfricaMiddle East & North Africa (excluding high income)Middle East & North Africa (IDA & IBRD countries)Middle incomeMoldovaMongoliaMontenegroMoroccoMozambiqueMyanmarNamibiaNauruNepalNetherlandsNew CaledoniaNew ZealandNicaraguaNigerNigeriaNorth AmericaNorwayOECD membersOmanOther small statesPacific island small statesPakistanPalauPanamaPapua New GuineaParaguayPeruPhilippinesPolandPortugalPost-demographic dividendPre-demographic dividendQatarRomaniaRussian FederationRwandaSamoaSao Tome and PrincipeSaudi ArabiaSenegalSerbiaSeychellesSierra LeoneSingaporeSlovak RepublicSloveniaSmall statesSolomon IslandsSomaliaSouth AfricaSouth AsiaSouth Asia (IDA & IBRD)South SudanSpainSri LankaSt. Kitts and NevisSt. LuciaSt. Vincent and the GrenadinesSub-Saharan Africa Sub-Saharan Africa (excluding high income)Sub-Saharan Africa (IDA & IBRD countries)SudanSurinameSwazilandSwedenSwitzerlandSyrian Arab RepublicTajikistanTanzaniaThailandTimor-LesteTogoTongaTrinidad and TobagoTunisiaTurkeyTurkmenistanTuvaluUgandaUkraineUnited Arab EmiratesUnited KingdomUnited StatesUpper middle incomeUruguayUzbekistanVanuatuVenezuela, RBVietnamWest Bank and GazaWorldYemen, Rep.ZambiaZimbabwe Timeline:
This timeline shows a graph from 1976 to 2016 of Guinea-Bissau. No data until 1975. Number of actual observations by date: 35.
Source name:
World Development Indicators
Source organization:
International Monetary Fund, International Financial Statistics and Balance of Payments databases, World Bank, International Debt Statistics, and World Bank and OECD GDP estimates.
Categories, topics:
Economy & Growth, Financial Sector, Climate Change
Last updated:
apr 23, 2017
Indicators value changes by year
Minimum:
-0.119
jan 1, 1976
At the date of observation
Value
Absolute change
Change from previous value
jan 1, 1976
-0.119
-0.119
0.0%
jan 1, 1978
0.035
+0.154
-129.17%
jan 1, 1980
0.194
+0.159
457.7%
jan 1, 1985
1.654
+1.46
752.28%
jan 1, 1986
1.001
-0.653
-39.47%
jan 1, 1987
0.63
-0.371
-37.09%
jan 1, 1988
0.069
-0.561
-89.04%
jan 1, 1989
0.413
+0.344
498.98%
jan 1, 1990
0.221
-0.193
-46.67%
jan 1, 1991
0.828
+0.607
275.49%
jan 1, 1992
0.813
-0.015
-1.84%
jan 1, 1993
2.576
+1.763
216.96%
jan 1, 1994
1.393
-1.183
-45.92%
jan 1, 1995
0.182
-1.211
-86.9%
jan 1, 1996
0.016
-0.167
-91.37%
jan 1, 1997
0.381
+0.365
2.32K%
jan 1, 1998
4.274
+3.894
1.02K%
jan 1, 1999
2.135
-2.14
-50.06%
jan 1, 2000
0.326
-1.809
-84.75%
jan 1, 2001
0.19
-0.136
-41.74%
jan 1, 2002
0.101
-0.089
-46.84%
jan 1, 2003
0.856
+0.755
749.12%
jan 1, 2004
0.841
-0.016
-1.81%
jan 1, 2005
0.361
-0.48
-57.1%
jan 1, 2006
1.481
+1.121
310.71%
jan 1, 2007
3.022
+1.541
104.03%
jan 1, 2008
2.698
-0.324
-10.72%
jan 1, 2009
0.767
-1.931
-71.57%
jan 1, 2010
2.287
+1.52
198.13%
jan 1, 2011
3.1
+0.813
35.54%
jan 1, 2012
2.264
-0.837
-26.99%
jan 1, 2013
0.665
-1.598
-70.6%
jan 1, 2014
1.913
+1.248
187.48%
jan 1, 2015
2.602
+0.689
36.0%
jan 1, 2016
1.736
-0.866
-33.28%
Ranking of countries by current statistics by years


Comments: