29
/
en
AIzaSyAYiBZKx7MnpbEhh9jyipgxe19OcubqV5w
April 1, 2024
247527
Spain
ESP
true
2
1
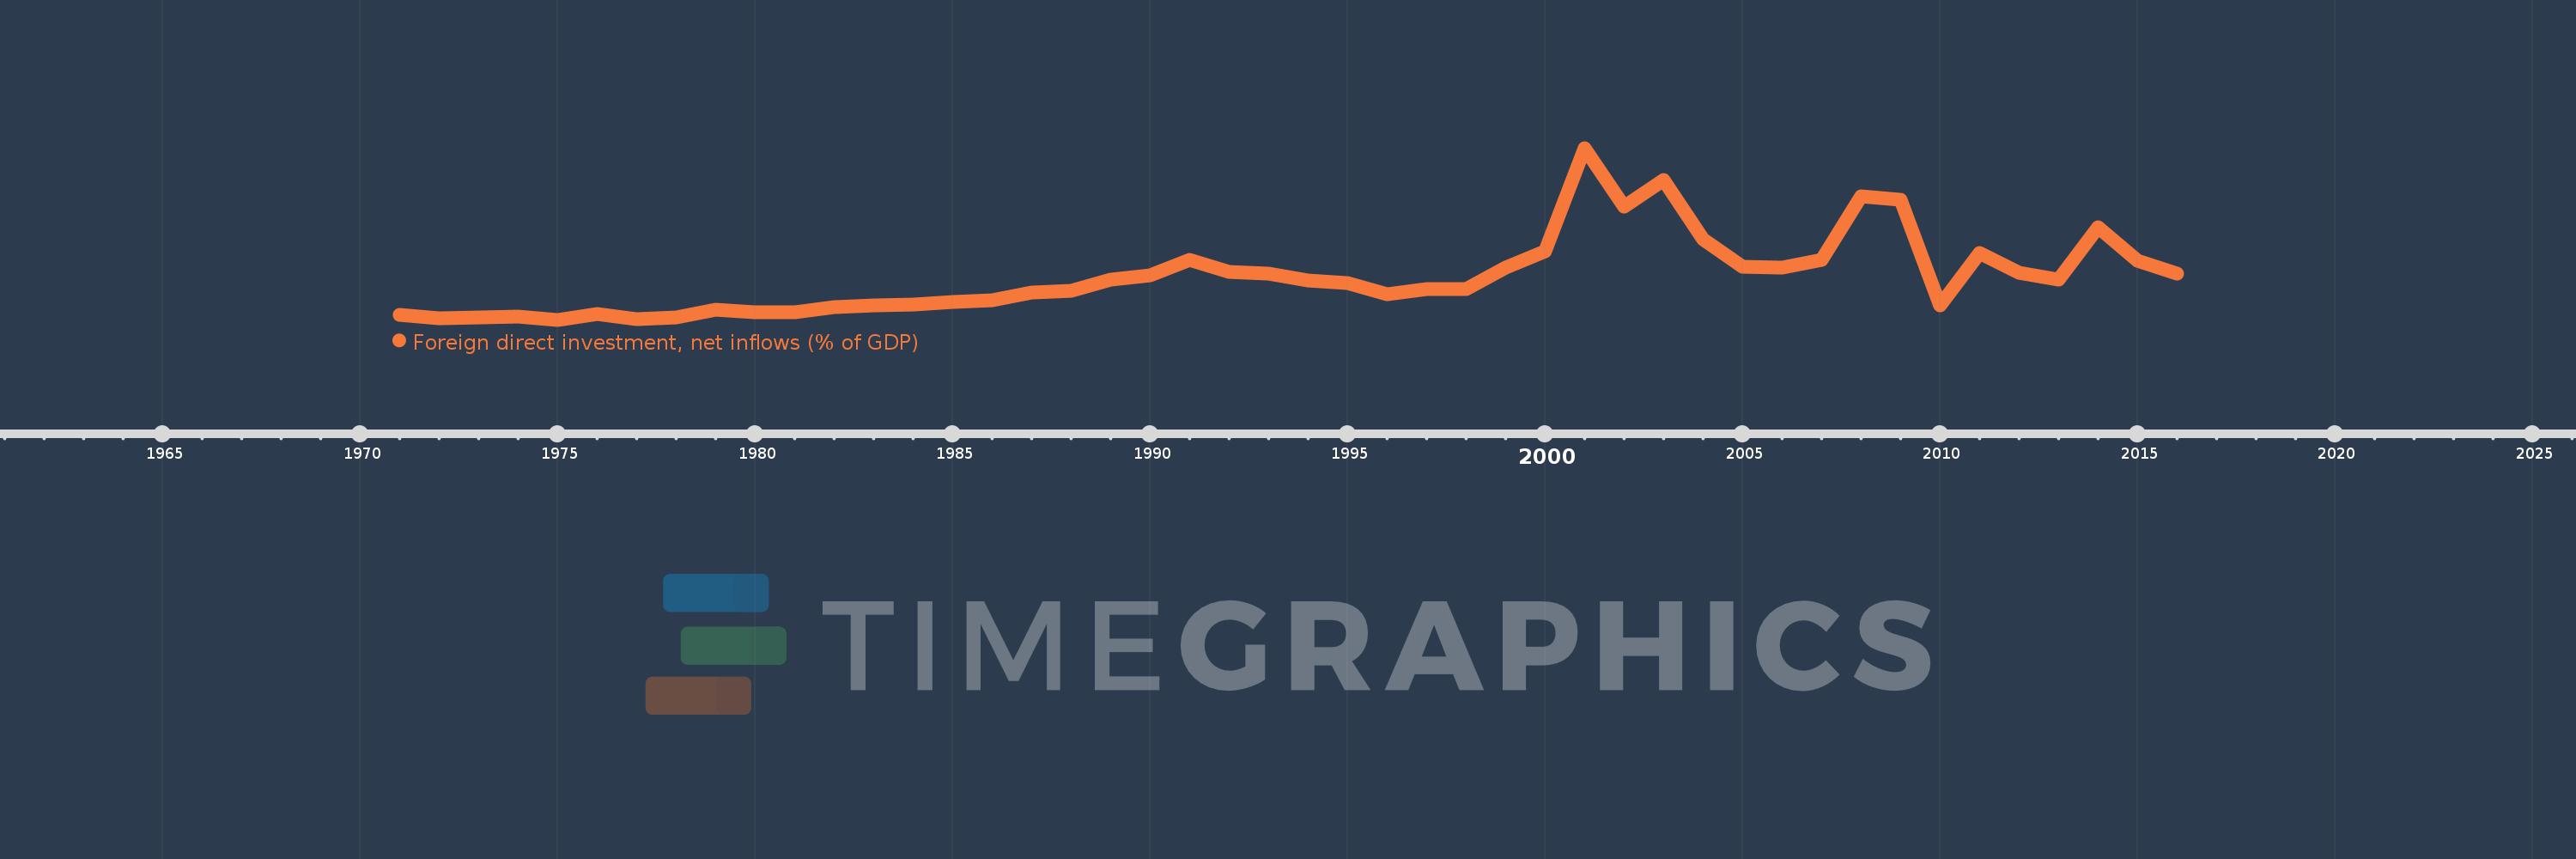
Foreign direct investment, net inflows (% of GDP)
2016,2015,2014,2013,2012,2011,2010,2009,2008,2007,2006,2005,2004,2003,2002,2001,2000,1999,1998,1997,1996,1995,1994,1993,1992,1991,1990,1989,1988,1987,1986,1985,1984,1983,1982,1981,1980,1979,1978,1977,1976,1975,1974,1973,1972,1971
This statistics in other country:
AfghanistanAlbaniaAlgeriaAngolaAntigua and BarbudaArab WorldArgentinaArmeniaArubaAustraliaAustriaAzerbaijanBahamas, TheBahrainBangladeshBarbadosBelarusBelgiumBelizeBeninBermudaBhutanBoliviaBosnia and HerzegovinaBotswanaBrazilBrunei DarussalamBulgariaBurkina FasoBurundiCabo VerdeCambodiaCameroonCanadaCaribbean small statesCayman IslandsCentral African RepublicCentral Europe and the BalticsChadChileChinaColombiaComorosCongo, Dem. Rep.Congo, Rep.Costa RicaCote d'IvoireCroatiaCyprusCzech RepublicDenmarkDjiboutiDominicaDominican RepublicEarly-demographic dividendEast Asia & PacificEast Asia & Pacific (excluding high income)East Asia & Pacific (IDA & IBRD countries)EcuadorEgypt, Arab Rep.El SalvadorEquatorial GuineaEritreaEstoniaEthiopiaEuro areaEurope & Central AsiaEurope & Central Asia (excluding high income)Europe & Central Asia (IDA & IBRD countries)European UnionFijiFinlandFragile and conflict affected situationsFranceFrench PolynesiaGabonGambia, TheGeorgiaGermanyGhanaGreeceGrenadaGuatemalaGuineaGuinea-BissauGuyanaHaitiHeavily indebted poor countries (HIPC)High incomeHondurasHong Kong SAR, ChinaHungaryIBRD onlyIcelandIDA & IBRD totalIDA blendIDA onlyIDA totalIndiaIndonesiaIran, Islamic Rep.IraqIrelandIsraelItalyJamaicaJapanJordanKazakhstanKenyaKiribatiKorea, Rep.KosovoKuwaitKyrgyz RepublicLao PDRLate-demographic dividendLatin America & Caribbean Latin America & Caribbean (excluding high income)Latin America & the Caribbean (IDA & IBRD countries)LatviaLeast developed countries: UN classificationLebanonLesothoLiberiaLibyaLithuaniaLow & middle incomeLow incomeLower middle incomeLuxembourgMacao SAR, ChinaMacedonia, FYRMadagascarMalawiMalaysiaMaldivesMaliMaltaMarshall IslandsMauritaniaMauritiusMexicoMicronesia, Fed. Sts.Middle East & North AfricaMiddle East & North Africa (excluding high income)Middle East & North Africa (IDA & IBRD countries)Middle incomeMoldovaMongoliaMontenegroMoroccoMozambiqueMyanmarNamibiaNauruNepalNetherlandsNew CaledoniaNew ZealandNicaraguaNigerNigeriaNorth AmericaNorwayOECD membersOmanOther small statesPacific island small statesPakistanPalauPanamaPapua New GuineaParaguayPeruPhilippinesPolandPortugalPost-demographic dividendPre-demographic dividendQatarRomaniaRussian FederationRwandaSamoaSao Tome and PrincipeSaudi ArabiaSenegalSerbiaSeychellesSierra LeoneSingaporeSlovak RepublicSloveniaSmall statesSolomon IslandsSomaliaSouth AfricaSouth AsiaSouth Asia (IDA & IBRD)South SudanSpainSri LankaSt. Kitts and NevisSt. LuciaSt. Vincent and the GrenadinesSub-Saharan Africa Sub-Saharan Africa (excluding high income)Sub-Saharan Africa (IDA & IBRD countries)SudanSurinameSwazilandSwedenSwitzerlandSyrian Arab RepublicTajikistanTanzaniaThailandTimor-LesteTogoTongaTrinidad and TobagoTunisiaTurkeyTurkmenistanTuvaluUgandaUkraineUnited Arab EmiratesUnited KingdomUnited StatesUpper middle incomeUruguayUzbekistanVanuatuVenezuela, RBVietnamWest Bank and GazaWorldYemen, Rep.ZambiaZimbabwe Timeline:
This timeline shows a graph from 1971 to 2016 of Spain. No data until 1970. Number of actual observations by date: 46.
Source name:
World Development Indicators
Source organization:
International Monetary Fund, International Financial Statistics and Balance of Payments databases, World Bank, International Debt Statistics, and World Bank and OECD GDP estimates.
Categories, topics:
Economy & Growth, Financial Sector, Climate Change
Last updated:
apr 23, 2017
Indicators value changes by year
At the date of observation
Value
Absolute change
Change from previous value
jan 1, 1971
0.543
+0.543
0.0%
jan 1, 1972
0.434
-0.109
-19.99%
jan 1, 1973
0.454
+0.02
4.6%
jan 1, 1974
0.497
+0.043
9.42%
jan 1, 1975
0.369
-0.128
-25.79%
jan 1, 1976
0.596
+0.227
61.6%
jan 1, 1977
0.404
-0.192
-32.23%
jan 1, 1978
0.46
+0.056
13.84%
jan 1, 1979
0.736
+0.276
59.9%
jan 1, 1980
0.653
-0.083
-11.28%
jan 1, 1981
0.643
-0.01
-1.47%
jan 1, 1982
0.844
+0.201
31.23%
jan 1, 1983
0.912
+0.068
8.08%
jan 1, 1984
0.952
+0.04
4.34%
jan 1, 1985
1.032
+0.081
8.48%
jan 1, 1986
1.091
+0.059
5.72%
jan 1, 1987
1.377
+0.285
26.14%
jan 1, 1988
1.438
+0.061
4.44%
jan 1, 1989
1.871
+0.434
30.16%
jan 1, 1990
2.038
+0.166
8.88%
jan 1, 1991
2.613
+0.576
28.25%
jan 1, 1992
2.17
-0.443
-16.95%
jan 1, 1993
2.11
-0.06
-2.79%
jan 1, 1994
1.849
-0.261
-12.37%
jan 1, 1995
1.742
-0.107
-5.79%
jan 1, 1996
1.319
-0.423
-24.26%
jan 1, 1997
1.501
+0.182
13.81%
jan 1, 1998
1.518
+0.017
1.12%
jan 1, 1999
2.315
+0.796
52.46%
jan 1, 2000
2.925
+0.611
26.39%
jan 1, 2001
6.8
+3.875
132.46%
jan 1, 2002
4.616
-2.185
-32.13%
jan 1, 2003
5.589
+0.973
21.09%
jan 1, 2004
3.39
-2.199
-39.35%
jan 1, 2005
2.354
-1.036
-30.56%
jan 1, 2006
2.309
-0.045
-1.91%
jan 1, 2007
2.609
+0.3
12.99%
jan 1, 2008
4.987
+2.378
91.15%
jan 1, 2009
4.866
-0.121
-2.42%
jan 1, 2010
0.899
-3.967
-81.52%
jan 1, 2011
2.865
+1.966
218.66%
jan 1, 2012
2.136
-0.729
-25.45%
jan 1, 2013
1.859
-0.277
-12.95%
jan 1, 2014
3.819
+1.959
105.37%
jan 1, 2015
2.59
-1.229
-32.18%
jan 1, 2016
2.11
-0.48
-18.53%
Ranking of countries by current statistics by years


Comments: