29
/
en
AIzaSyAYiBZKx7MnpbEhh9jyipgxe19OcubqV5w
April 1, 2024
240435
Singapore
SGP
true
2
1
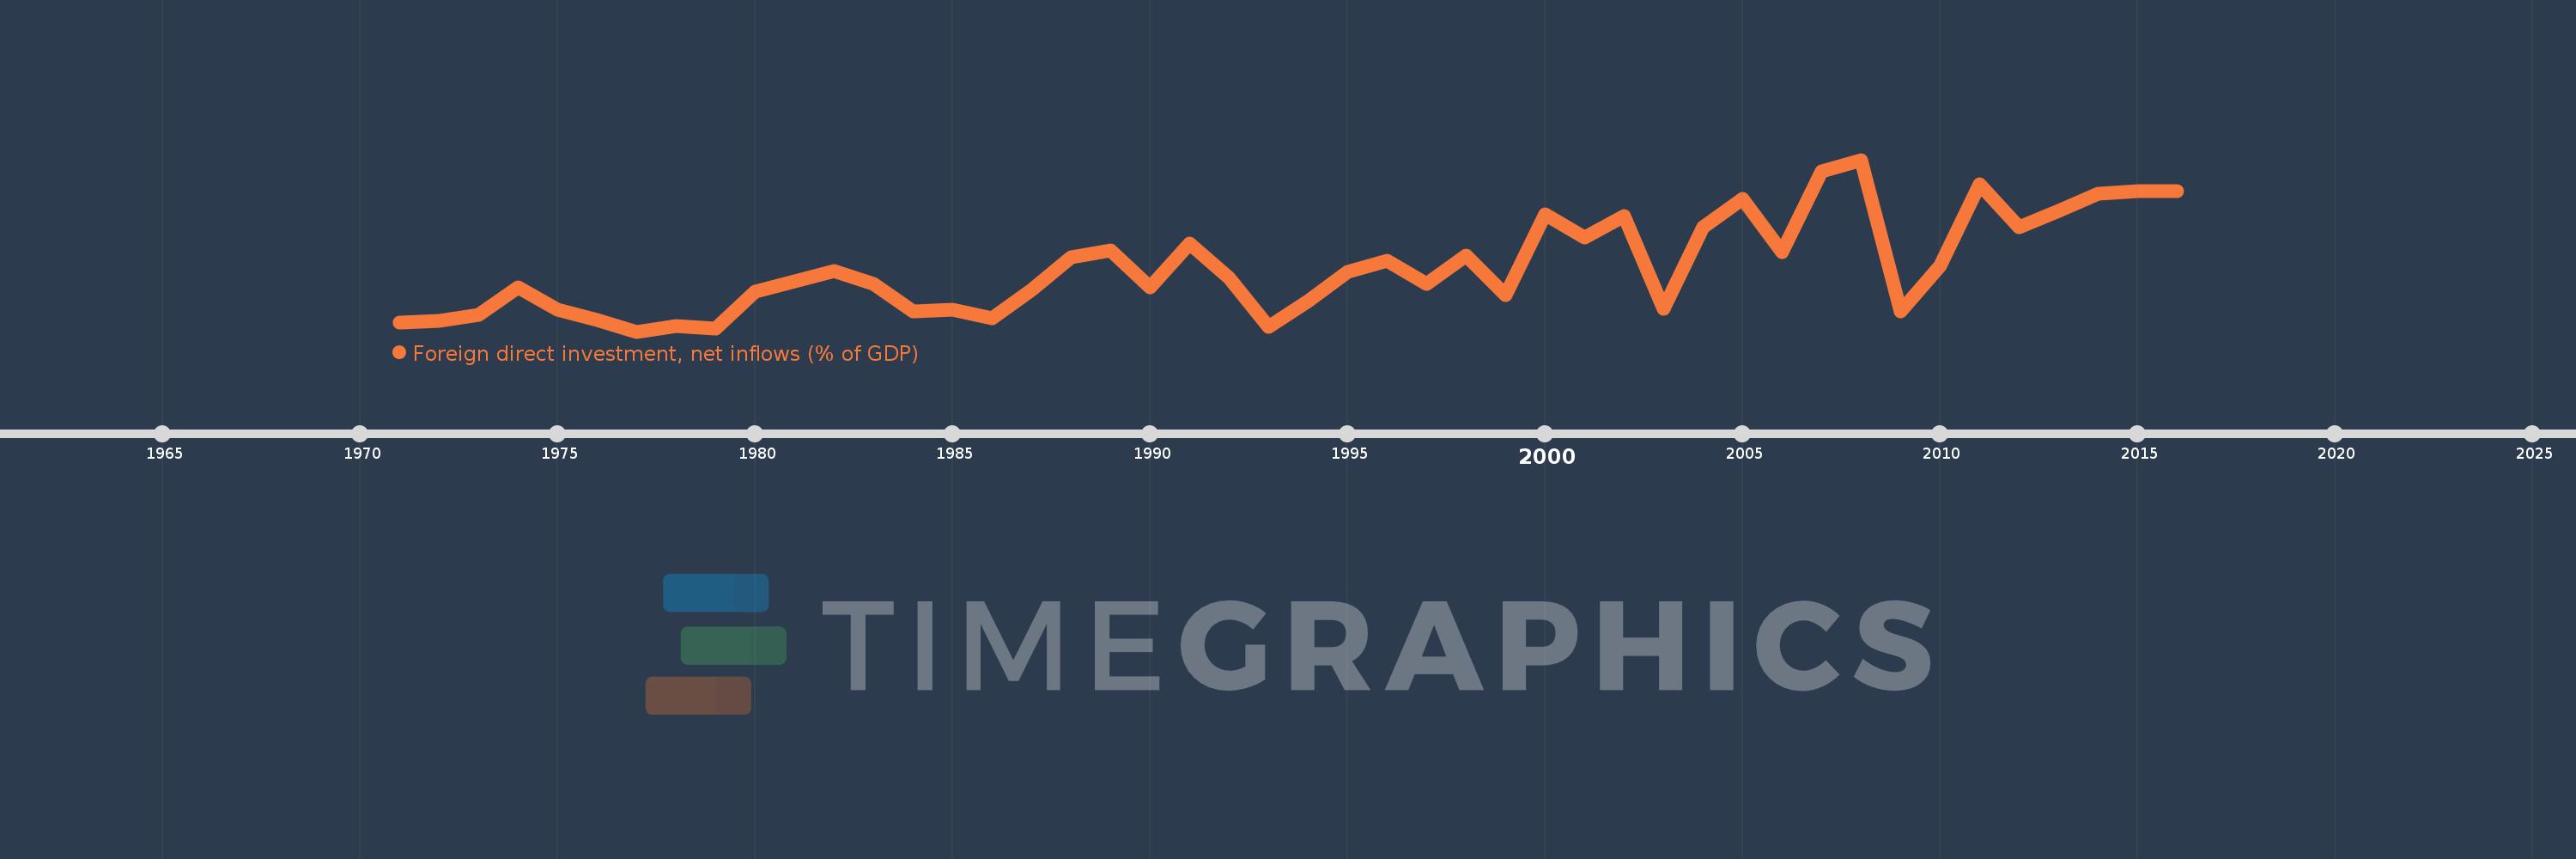
Foreign direct investment, net inflows (% of GDP)
2016,2015,2014,2013,2012,2011,2010,2009,2008,2007,2006,2005,2004,2003,2002,2001,2000,1999,1998,1997,1996,1995,1994,1993,1992,1991,1990,1989,1988,1987,1986,1985,1984,1983,1982,1981,1980,1979,1978,1977,1976,1975,1974,1973,1972,1971
This statistics in other country:
AfghanistanAlbaniaAlgeriaAngolaAntigua and BarbudaArab WorldArgentinaArmeniaArubaAustraliaAustriaAzerbaijanBahamas, TheBahrainBangladeshBarbadosBelarusBelgiumBelizeBeninBermudaBhutanBoliviaBosnia and HerzegovinaBotswanaBrazilBrunei DarussalamBulgariaBurkina FasoBurundiCabo VerdeCambodiaCameroonCanadaCaribbean small statesCayman IslandsCentral African RepublicCentral Europe and the BalticsChadChileChinaColombiaComorosCongo, Dem. Rep.Congo, Rep.Costa RicaCote d'IvoireCroatiaCyprusCzech RepublicDenmarkDjiboutiDominicaDominican RepublicEarly-demographic dividendEast Asia & PacificEast Asia & Pacific (excluding high income)East Asia & Pacific (IDA & IBRD countries)EcuadorEgypt, Arab Rep.El SalvadorEquatorial GuineaEritreaEstoniaEthiopiaEuro areaEurope & Central AsiaEurope & Central Asia (excluding high income)Europe & Central Asia (IDA & IBRD countries)European UnionFijiFinlandFragile and conflict affected situationsFranceFrench PolynesiaGabonGambia, TheGeorgiaGermanyGhanaGreeceGrenadaGuatemalaGuineaGuinea-BissauGuyanaHaitiHeavily indebted poor countries (HIPC)High incomeHondurasHong Kong SAR, ChinaHungaryIBRD onlyIcelandIDA & IBRD totalIDA blendIDA onlyIDA totalIndiaIndonesiaIran, Islamic Rep.IraqIrelandIsraelItalyJamaicaJapanJordanKazakhstanKenyaKiribatiKorea, Rep.KosovoKuwaitKyrgyz RepublicLao PDRLate-demographic dividendLatin America & Caribbean Latin America & Caribbean (excluding high income)Latin America & the Caribbean (IDA & IBRD countries)LatviaLeast developed countries: UN classificationLebanonLesothoLiberiaLibyaLithuaniaLow & middle incomeLow incomeLower middle incomeLuxembourgMacao SAR, ChinaMacedonia, FYRMadagascarMalawiMalaysiaMaldivesMaliMaltaMarshall IslandsMauritaniaMauritiusMexicoMicronesia, Fed. Sts.Middle East & North AfricaMiddle East & North Africa (excluding high income)Middle East & North Africa (IDA & IBRD countries)Middle incomeMoldovaMongoliaMontenegroMoroccoMozambiqueMyanmarNamibiaNauruNepalNetherlandsNew CaledoniaNew ZealandNicaraguaNigerNigeriaNorth AmericaNorwayOECD membersOmanOther small statesPacific island small statesPakistanPalauPanamaPapua New GuineaParaguayPeruPhilippinesPolandPortugalPost-demographic dividendPre-demographic dividendQatarRomaniaRussian FederationRwandaSamoaSao Tome and PrincipeSaudi ArabiaSenegalSerbiaSeychellesSierra LeoneSingaporeSlovak RepublicSloveniaSmall statesSolomon IslandsSomaliaSouth AfricaSouth AsiaSouth Asia (IDA & IBRD)South SudanSpainSri LankaSt. Kitts and NevisSt. LuciaSt. Vincent and the GrenadinesSub-Saharan Africa Sub-Saharan Africa (excluding high income)Sub-Saharan Africa (IDA & IBRD countries)SudanSurinameSwazilandSwedenSwitzerlandSyrian Arab RepublicTajikistanTanzaniaThailandTimor-LesteTogoTongaTrinidad and TobagoTunisiaTurkeyTurkmenistanTuvaluUgandaUkraineUnited Arab EmiratesUnited KingdomUnited StatesUpper middle incomeUruguayUzbekistanVanuatuVenezuela, RBVietnamWest Bank and GazaWorldYemen, Rep.ZambiaZimbabwe Timeline:
This timeline shows a graph from 1971 to 2016 of Singapore. No data until 1970. Number of actual observations by date: 46.
Source name:
World Development Indicators
Source organization:
International Monetary Fund, International Financial Statistics and Balance of Payments databases, World Bank, International Debt Statistics, and World Bank and OECD GDP estimates.
Categories, topics:
Economy & Growth, Financial Sector, Climate Change
Last updated:
apr 23, 2017
Indicators value changes by year
Maximum:
26.521
jan 1, 2008
At the date of observation
Value
Absolute change
Change from previous value
jan 1, 1971
4.845
+4.845
0.0%
jan 1, 1972
5.127
+0.282
5.82%
jan 1, 1973
5.922
+0.795
15.5%
jan 1, 1974
9.552
+3.63
61.3%
jan 1, 1975
6.521
-3.031
-31.73%
jan 1, 1976
5.18
-1.341
-20.56%
jan 1, 1977
3.646
-1.534
-29.61%
jan 1, 1978
4.404
+0.758
20.79%
jan 1, 1979
3.99
-0.414
-9.4%
jan 1, 1980
8.995
+5.004
125.41%
jan 1, 1981
10.39
+1.395
15.51%
jan 1, 1982
11.713
+1.323
12.73%
jan 1, 1983
9.962
-1.751
-14.95%
jan 1, 1984
6.379
-3.583
-35.97%
jan 1, 1985
6.596
+0.217
3.41%
jan 1, 1986
5.469
-1.127
-17.09%
jan 1, 1987
9.21
+3.741
68.4%
jan 1, 1988
13.572
+4.362
47.36%
jan 1, 1989
14.425
+0.853
6.28%
jan 1, 1990
9.488
-4.937
-34.22%
jan 1, 1991
15.42
+5.932
62.52%
jan 1, 1992
10.747
-4.673
-30.31%
jan 1, 1993
4.226
-6.52
-60.67%
jan 1, 1994
7.728
+3.501
82.84%
jan 1, 1995
11.589
+3.862
49.97%
jan 1, 1996
13.125
+1.536
13.25%
jan 1, 1997
10.043
-3.081
-23.48%
jan 1, 1998
13.73
+3.687
36.71%
jan 1, 1999
8.534
-5.197
-37.85%
jan 1, 2000
19.213
+10.68
125.15%
jan 1, 2001
16.19
-3.024
-15.74%
jan 1, 2002
19.048
+2.858
17.65%
jan 1, 2003
6.697
-12.351
-64.84%
jan 1, 2004
17.579
+10.882
162.49%
jan 1, 2005
21.36
+3.781
21.51%
jan 1, 2006
14.198
-7.162
-33.53%
jan 1, 2007
24.983
+10.785
75.96%
jan 1, 2008
26.521
+1.538
6.16%
jan 1, 2009
6.347
-20.174
-76.07%
jan 1, 2010
12.381
+6.033
95.06%
jan 1, 2011
23.296
+10.915
88.16%
jan 1, 2012
17.56
-5.735
-24.62%
jan 1, 2013
19.757
+2.197
12.51%
jan 1, 2014
22.001
+2.244
11.36%
jan 1, 2015
22.359
+0.358
1.63%
jan 1, 2016
22.294
-0.065
-0.29%
Ranking of countries by current statistics by years


Comments: