29
/
en
AIzaSyAYiBZKx7MnpbEhh9jyipgxe19OcubqV5w
April 1, 2024
178840
Liberia
LBR
true
2
1
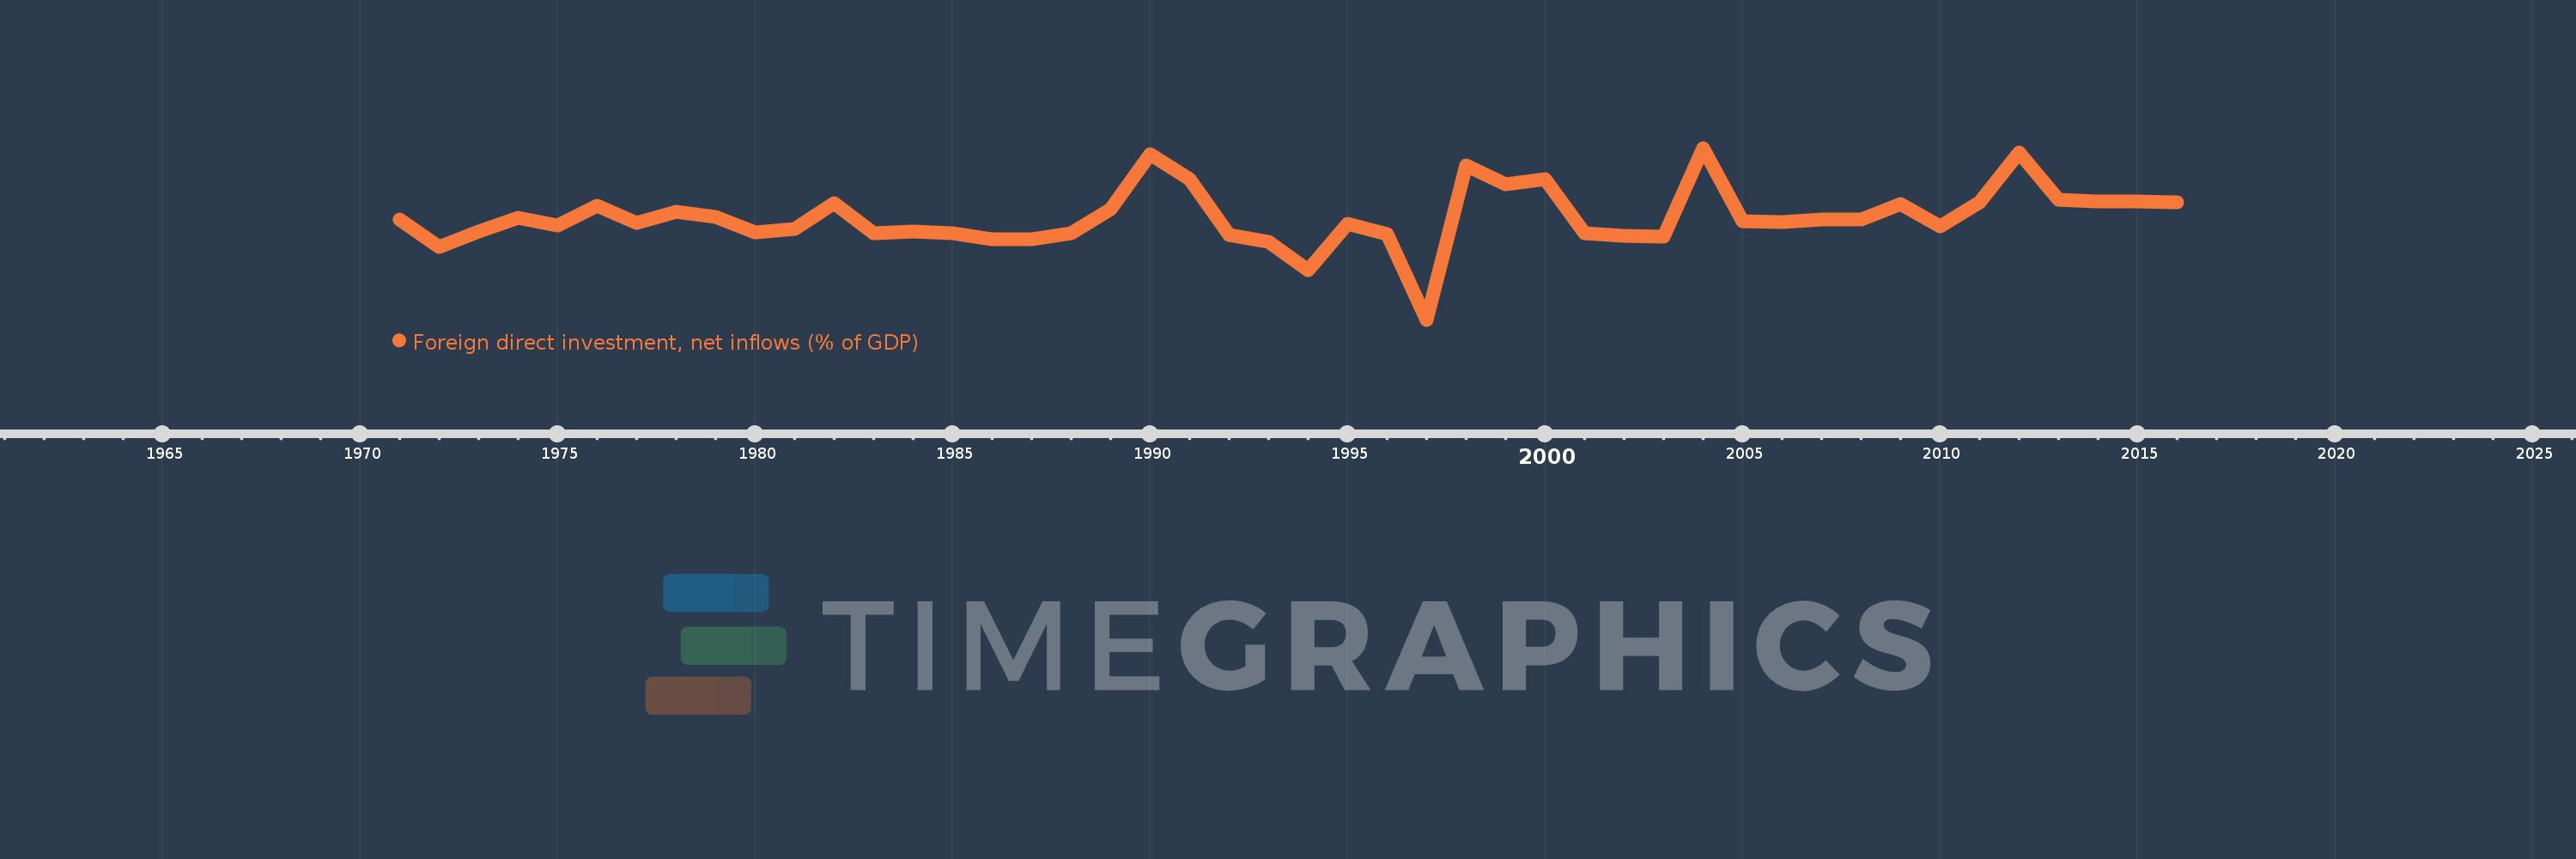
Foreign direct investment, net inflows (% of GDP)
2016,2015,2014,2013,2012,2011,2010,2009,2008,2007,2006,2005,2004,2003,2002,2001,2000,1999,1998,1997,1996,1995,1994,1993,1992,1991,1990,1989,1988,1987,1986,1985,1984,1983,1982,1981,1980,1979,1978,1977,1976,1975,1974,1973,1972,1971
This statistics in other country:
AfghanistanAlbaniaAlgeriaAngolaAntigua and BarbudaArab WorldArgentinaArmeniaArubaAustraliaAustriaAzerbaijanBahamas, TheBahrainBangladeshBarbadosBelarusBelgiumBelizeBeninBermudaBhutanBoliviaBosnia and HerzegovinaBotswanaBrazilBrunei DarussalamBulgariaBurkina FasoBurundiCabo VerdeCambodiaCameroonCanadaCaribbean small statesCayman IslandsCentral African RepublicCentral Europe and the BalticsChadChileChinaColombiaComorosCongo, Dem. Rep.Congo, Rep.Costa RicaCote d'IvoireCroatiaCyprusCzech RepublicDenmarkDjiboutiDominicaDominican RepublicEarly-demographic dividendEast Asia & PacificEast Asia & Pacific (excluding high income)East Asia & Pacific (IDA & IBRD countries)EcuadorEgypt, Arab Rep.El SalvadorEquatorial GuineaEritreaEstoniaEthiopiaEuro areaEurope & Central AsiaEurope & Central Asia (excluding high income)Europe & Central Asia (IDA & IBRD countries)European UnionFijiFinlandFragile and conflict affected situationsFranceFrench PolynesiaGabonGambia, TheGeorgiaGermanyGhanaGreeceGrenadaGuatemalaGuineaGuinea-BissauGuyanaHaitiHeavily indebted poor countries (HIPC)High incomeHondurasHong Kong SAR, ChinaHungaryIBRD onlyIcelandIDA & IBRD totalIDA blendIDA onlyIDA totalIndiaIndonesiaIran, Islamic Rep.IraqIrelandIsraelItalyJamaicaJapanJordanKazakhstanKenyaKiribatiKorea, Rep.KosovoKuwaitKyrgyz RepublicLao PDRLate-demographic dividendLatin America & Caribbean Latin America & Caribbean (excluding high income)Latin America & the Caribbean (IDA & IBRD countries)LatviaLeast developed countries: UN classificationLebanonLesothoLiberiaLibyaLithuaniaLow & middle incomeLow incomeLower middle incomeLuxembourgMacao SAR, ChinaMacedonia, FYRMadagascarMalawiMalaysiaMaldivesMaliMaltaMarshall IslandsMauritaniaMauritiusMexicoMicronesia, Fed. Sts.Middle East & North AfricaMiddle East & North Africa (excluding high income)Middle East & North Africa (IDA & IBRD countries)Middle incomeMoldovaMongoliaMontenegroMoroccoMozambiqueMyanmarNamibiaNauruNepalNetherlandsNew CaledoniaNew ZealandNicaraguaNigerNigeriaNorth AmericaNorwayOECD membersOmanOther small statesPacific island small statesPakistanPalauPanamaPapua New GuineaParaguayPeruPhilippinesPolandPortugalPost-demographic dividendPre-demographic dividendQatarRomaniaRussian FederationRwandaSamoaSao Tome and PrincipeSaudi ArabiaSenegalSerbiaSeychellesSierra LeoneSingaporeSlovak RepublicSloveniaSmall statesSolomon IslandsSomaliaSouth AfricaSouth AsiaSouth Asia (IDA & IBRD)South SudanSpainSri LankaSt. Kitts and NevisSt. LuciaSt. Vincent and the GrenadinesSub-Saharan Africa Sub-Saharan Africa (excluding high income)Sub-Saharan Africa (IDA & IBRD countries)SudanSurinameSwazilandSwedenSwitzerlandSyrian Arab RepublicTajikistanTanzaniaThailandTimor-LesteTogoTongaTrinidad and TobagoTunisiaTurkeyTurkmenistanTuvaluUgandaUkraineUnited Arab EmiratesUnited KingdomUnited StatesUpper middle incomeUruguayUzbekistanVanuatuVenezuela, RBVietnamWest Bank and GazaWorldYemen, Rep.ZambiaZimbabwe Timeline:
This timeline shows a graph from 1971 to 2016 of Liberia. No data until 1970. Number of actual observations by date: 46.
Source name:
World Development Indicators
Source organization:
International Monetary Fund, International Financial Statistics and Balance of Payments databases, World Bank, International Debt Statistics, and World Bank and OECD GDP estimates.
Categories, topics:
Economy & Growth, Financial Sector, Climate Change
Last updated:
apr 23, 2017
Indicators value changes by year
Minimum:
-82.892
jan 1, 1997
Maximum:
89.476
jan 1, 2004
At the date of observation
Value
Absolute change
Change from previous value
jan 1, 1971
17.685
+17.685
0.0%
jan 1, 1972
-9.943
-27.628
-156.22%
jan 1, 1973
5.61
+15.553
-156.42%
jan 1, 1974
19.34
+13.73
244.75%
jan 1, 1975
11.851
-7.489
-38.72%
jan 1, 1976
31.237
+19.386
163.58%
jan 1, 1977
13.939
-17.298
-55.38%
jan 1, 1978
25.326
+11.388
81.7%
jan 1, 1979
20.173
-5.153
-20.35%
jan 1, 1980
5.062
-15.111
-74.91%
jan 1, 1981
8.415
+3.352
66.22%
jan 1, 1982
34.016
+25.601
304.25%
jan 1, 1983
4.028
-29.988
-88.16%
jan 1, 1984
5.963
+1.935
48.04%
jan 1, 1985
4.266
-1.697
-28.45%
jan 1, 1986
-1.903
-6.169
-144.6%
jan 1, 1987
-1.962
-0.059
3.1%
jan 1, 1988
3.958
+5.92
-301.71%
jan 1, 1989
27.945
+23.987
606.09%
jan 1, 1990
83.434
+55.489
198.57%
jan 1, 1991
58.595
-24.839
-29.77%
jan 1, 1992
2.417
-56.179
-95.88%
jan 1, 1993
-4.855
-7.271
-300.88%
jan 1, 1994
-33.429
-28.574
588.61%
jan 1, 1995
13.147
+46.576
-139.33%
jan 1, 1996
3.412
-9.734
-74.04%
jan 1, 1997
-82.892
-86.305
-2.53K%
jan 1, 1998
72.261
+155.153
-187.17%
jan 1, 1999
52.923
-19.338
-26.76%
jan 1, 2000
58.004
+5.081
9.6%
jan 1, 2001
3.931
-54.072
-93.22%
jan 1, 2002
1.593
-2.338
-59.48%
jan 1, 2003
0.516
-1.077
-67.63%
jan 1, 2004
89.476
+88.96
17.25K%
jan 1, 2005
15.874
-73.602
-82.26%
jan 1, 2006
15.055
-0.819
-5.16%
jan 1, 2007
17.856
+2.801
18.61%
jan 1, 2008
17.812
-0.044
-0.25%
jan 1, 2009
33.356
+15.543
87.26%
jan 1, 2010
11.064
-22.292
-66.83%
jan 1, 2011
34.992
+23.928
216.28%
jan 1, 2012
84.946
+49.953
142.76%
jan 1, 2013
37.257
-47.688
-56.14%
jan 1, 2014
35.976
-1.282
-3.44%
jan 1, 2015
35.771
-0.204
-0.57%
jan 1, 2016
35.121
-0.65
-1.82%
Ranking of countries by current statistics by years


Comments: