29
/
en
AIzaSyAYiBZKx7MnpbEhh9jyipgxe19OcubqV5w
April 1, 2024
38141
IDA blend
IDB
false
2
1
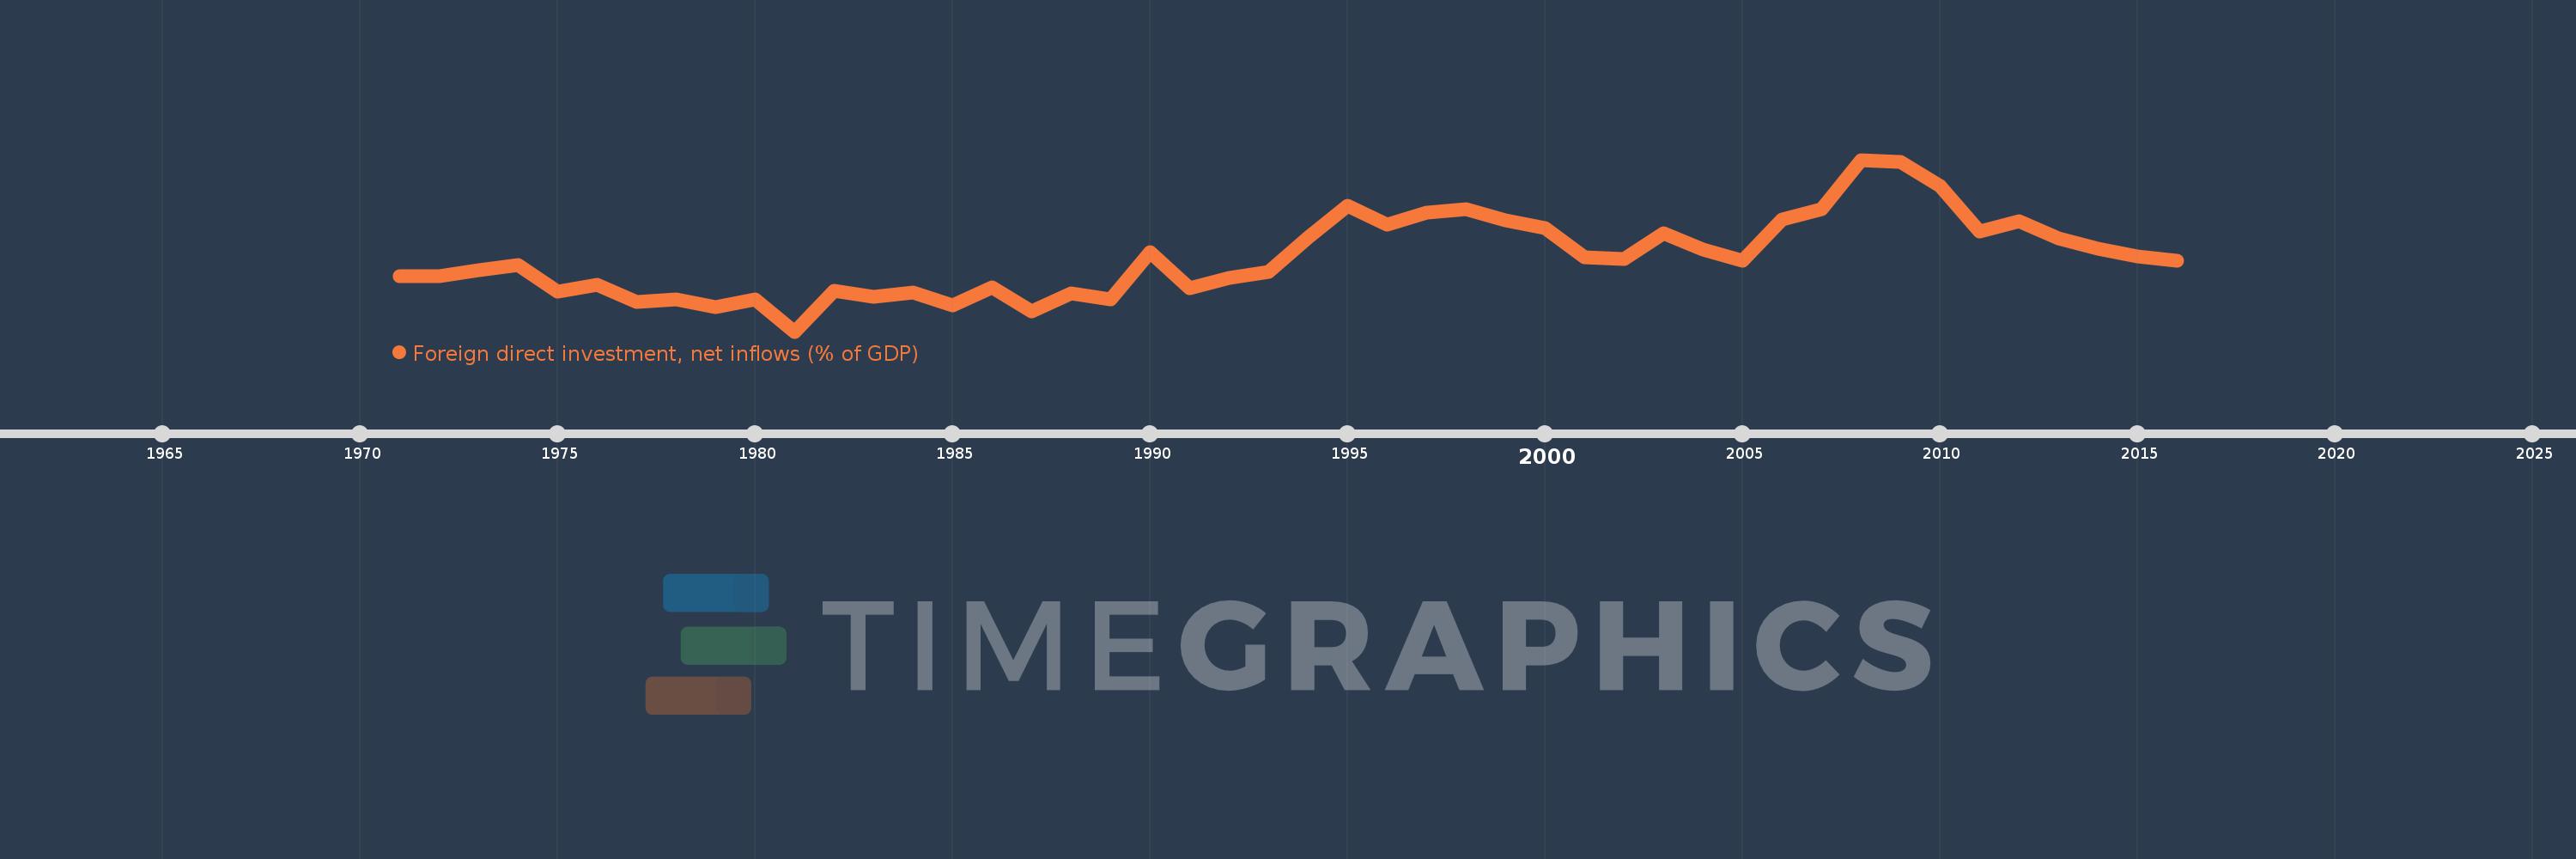
Foreign direct investment, net inflows (% of GDP)
2016,2015,2014,2013,2012,2011,2010,2009,2008,2007,2006,2005,2004,2003,2002,2001,2000,1999,1998,1997,1996,1995,1994,1993,1992,1991,1990,1989,1988,1987,1986,1985,1984,1983,1982,1981,1980,1979,1978,1977,1976,1975,1974,1973,1972,1971
This statistics in other country:
AfghanistanAlbaniaAlgeriaAngolaAntigua and BarbudaArab WorldArgentinaArmeniaArubaAustraliaAustriaAzerbaijanBahamas, TheBahrainBangladeshBarbadosBelarusBelgiumBelizeBeninBermudaBhutanBoliviaBosnia and HerzegovinaBotswanaBrazilBrunei DarussalamBulgariaBurkina FasoBurundiCabo VerdeCambodiaCameroonCanadaCaribbean small statesCayman IslandsCentral African RepublicCentral Europe and the BalticsChadChileChinaColombiaComorosCongo, Dem. Rep.Congo, Rep.Costa RicaCote d'IvoireCroatiaCyprusCzech RepublicDenmarkDjiboutiDominicaDominican RepublicEarly-demographic dividendEast Asia & PacificEast Asia & Pacific (excluding high income)East Asia & Pacific (IDA & IBRD countries)EcuadorEgypt, Arab Rep.El SalvadorEquatorial GuineaEritreaEstoniaEthiopiaEuro areaEurope & Central AsiaEurope & Central Asia (excluding high income)Europe & Central Asia (IDA & IBRD countries)European UnionFijiFinlandFragile and conflict affected situationsFranceFrench PolynesiaGabonGambia, TheGeorgiaGermanyGhanaGreeceGrenadaGuatemalaGuineaGuinea-BissauGuyanaHaitiHeavily indebted poor countries (HIPC)High incomeHondurasHong Kong SAR, ChinaHungaryIBRD onlyIcelandIDA & IBRD totalIDA blendIDA onlyIDA totalIndiaIndonesiaIran, Islamic Rep.IraqIrelandIsraelItalyJamaicaJapanJordanKazakhstanKenyaKiribatiKorea, Rep.KosovoKuwaitKyrgyz RepublicLao PDRLate-demographic dividendLatin America & Caribbean Latin America & Caribbean (excluding high income)Latin America & the Caribbean (IDA & IBRD countries)LatviaLeast developed countries: UN classificationLebanonLesothoLiberiaLibyaLithuaniaLow & middle incomeLow incomeLower middle incomeLuxembourgMacao SAR, ChinaMacedonia, FYRMadagascarMalawiMalaysiaMaldivesMaliMaltaMarshall IslandsMauritaniaMauritiusMexicoMicronesia, Fed. Sts.Middle East & North AfricaMiddle East & North Africa (excluding high income)Middle East & North Africa (IDA & IBRD countries)Middle incomeMoldovaMongoliaMontenegroMoroccoMozambiqueMyanmarNamibiaNauruNepalNetherlandsNew CaledoniaNew ZealandNicaraguaNigerNigeriaNorth AmericaNorwayOECD membersOmanOther small statesPacific island small statesPakistanPalauPanamaPapua New GuineaParaguayPeruPhilippinesPolandPortugalPost-demographic dividendPre-demographic dividendQatarRomaniaRussian FederationRwandaSamoaSao Tome and PrincipeSaudi ArabiaSenegalSerbiaSeychellesSierra LeoneSingaporeSlovak RepublicSloveniaSmall statesSolomon IslandsSomaliaSouth AfricaSouth AsiaSouth Asia (IDA & IBRD)South SudanSpainSri LankaSt. Kitts and NevisSt. LuciaSt. Vincent and the GrenadinesSub-Saharan Africa Sub-Saharan Africa (excluding high income)Sub-Saharan Africa (IDA & IBRD countries)SudanSurinameSwazilandSwedenSwitzerlandSyrian Arab RepublicTajikistanTanzaniaThailandTimor-LesteTogoTongaTrinidad and TobagoTunisiaTurkeyTurkmenistanTuvaluUgandaUkraineUnited Arab EmiratesUnited KingdomUnited StatesUpper middle incomeUruguayUzbekistanVanuatuVenezuela, RBVietnamWest Bank and GazaWorldYemen, Rep.ZambiaZimbabwe Timeline:
This timeline shows a graph from 1971 to 2016 of IDA blend. No data until 1970. Number of actual observations by date: 46.
Source name:
World Development Indicators
Source organization:
International Monetary Fund, International Financial Statistics and Balance of Payments databases, World Bank, International Debt Statistics, and World Bank and OECD GDP estimates.
Categories, topics:
Economy & Growth, Financial Sector, Climate Change
Last updated:
apr 23, 2017
Indicators value changes by year
Minimum:
-0.229
jan 1, 1981
At the date of observation
Value
Absolute change
Change from previous value
jan 1, 1971
1.393
+1.393
0.0%
jan 1, 1972
1.371
-0.021
-1.54%
jan 1, 1973
1.548
+0.177
12.89%
jan 1, 1974
1.708
+0.16
10.35%
jan 1, 1975
0.922
-0.786
-46.01%
jan 1, 1976
1.143
+0.221
23.95%
jan 1, 1977
0.63
-0.514
-44.93%
jan 1, 1978
0.703
+0.074
11.74%
jan 1, 1979
0.473
-0.231
-32.77%
jan 1, 1980
0.706
+0.233
49.31%
jan 1, 1981
-0.229
-0.935
-132.49%
jan 1, 1982
0.957
+1.187
-517.24%
jan 1, 1983
0.778
-0.179
-18.75%
jan 1, 1984
0.912
+0.134
17.24%
jan 1, 1985
0.52
-0.392
-42.99%
jan 1, 1986
1.057
+0.537
103.25%
jan 1, 1987
0.359
-0.698
-66.04%
jan 1, 1988
0.881
+0.523
145.64%
jan 1, 1989
0.713
-0.168
-19.08%
jan 1, 1990
2.075
+1.361
190.92%
jan 1, 1991
1.035
-1.04
-50.12%
jan 1, 1992
1.321
+0.287
27.71%
jan 1, 1993
1.512
+0.19
14.4%
jan 1, 1994
2.5
+0.989
65.4%
jan 1, 1995
3.437
+0.937
37.46%
jan 1, 1996
2.877
-0.56
-16.29%
jan 1, 1997
3.238
+0.36
12.53%
jan 1, 1998
3.324
+0.086
2.66%
jan 1, 1999
3.012
-0.312
-9.38%
jan 1, 2000
2.78
-0.232
-7.7%
jan 1, 2001
1.94
-0.84
-30.2%
jan 1, 2002
1.869
-0.072
-3.7%
jan 1, 2003
2.628
+0.76
40.66%
jan 1, 2004
2.156
-0.472
-17.96%
jan 1, 2005
1.825
-0.331
-15.36%
jan 1, 2006
3.026
+1.201
65.78%
jan 1, 2007
3.34
+0.315
10.4%
jan 1, 2008
4.764
+1.424
42.63%
jan 1, 2009
4.704
-0.06
-1.25%
jan 1, 2010
3.995
-0.709
-15.07%
jan 1, 2011
2.672
-1.324
-33.13%
jan 1, 2012
2.968
+0.297
11.1%
jan 1, 2013
2.476
-0.492
-16.59%
jan 1, 2014
2.183
-0.293
-11.81%
jan 1, 2015
1.95
-0.233
-10.67%
jan 1, 2016
1.822
-0.129
-6.6%
Ranking of countries by current statistics by years


Comments: