29
/
en
AIzaSyAYiBZKx7MnpbEhh9jyipgxe19OcubqV5w
April 1, 2024
41437
Latin America & Caribbean
LCN
false
2
1
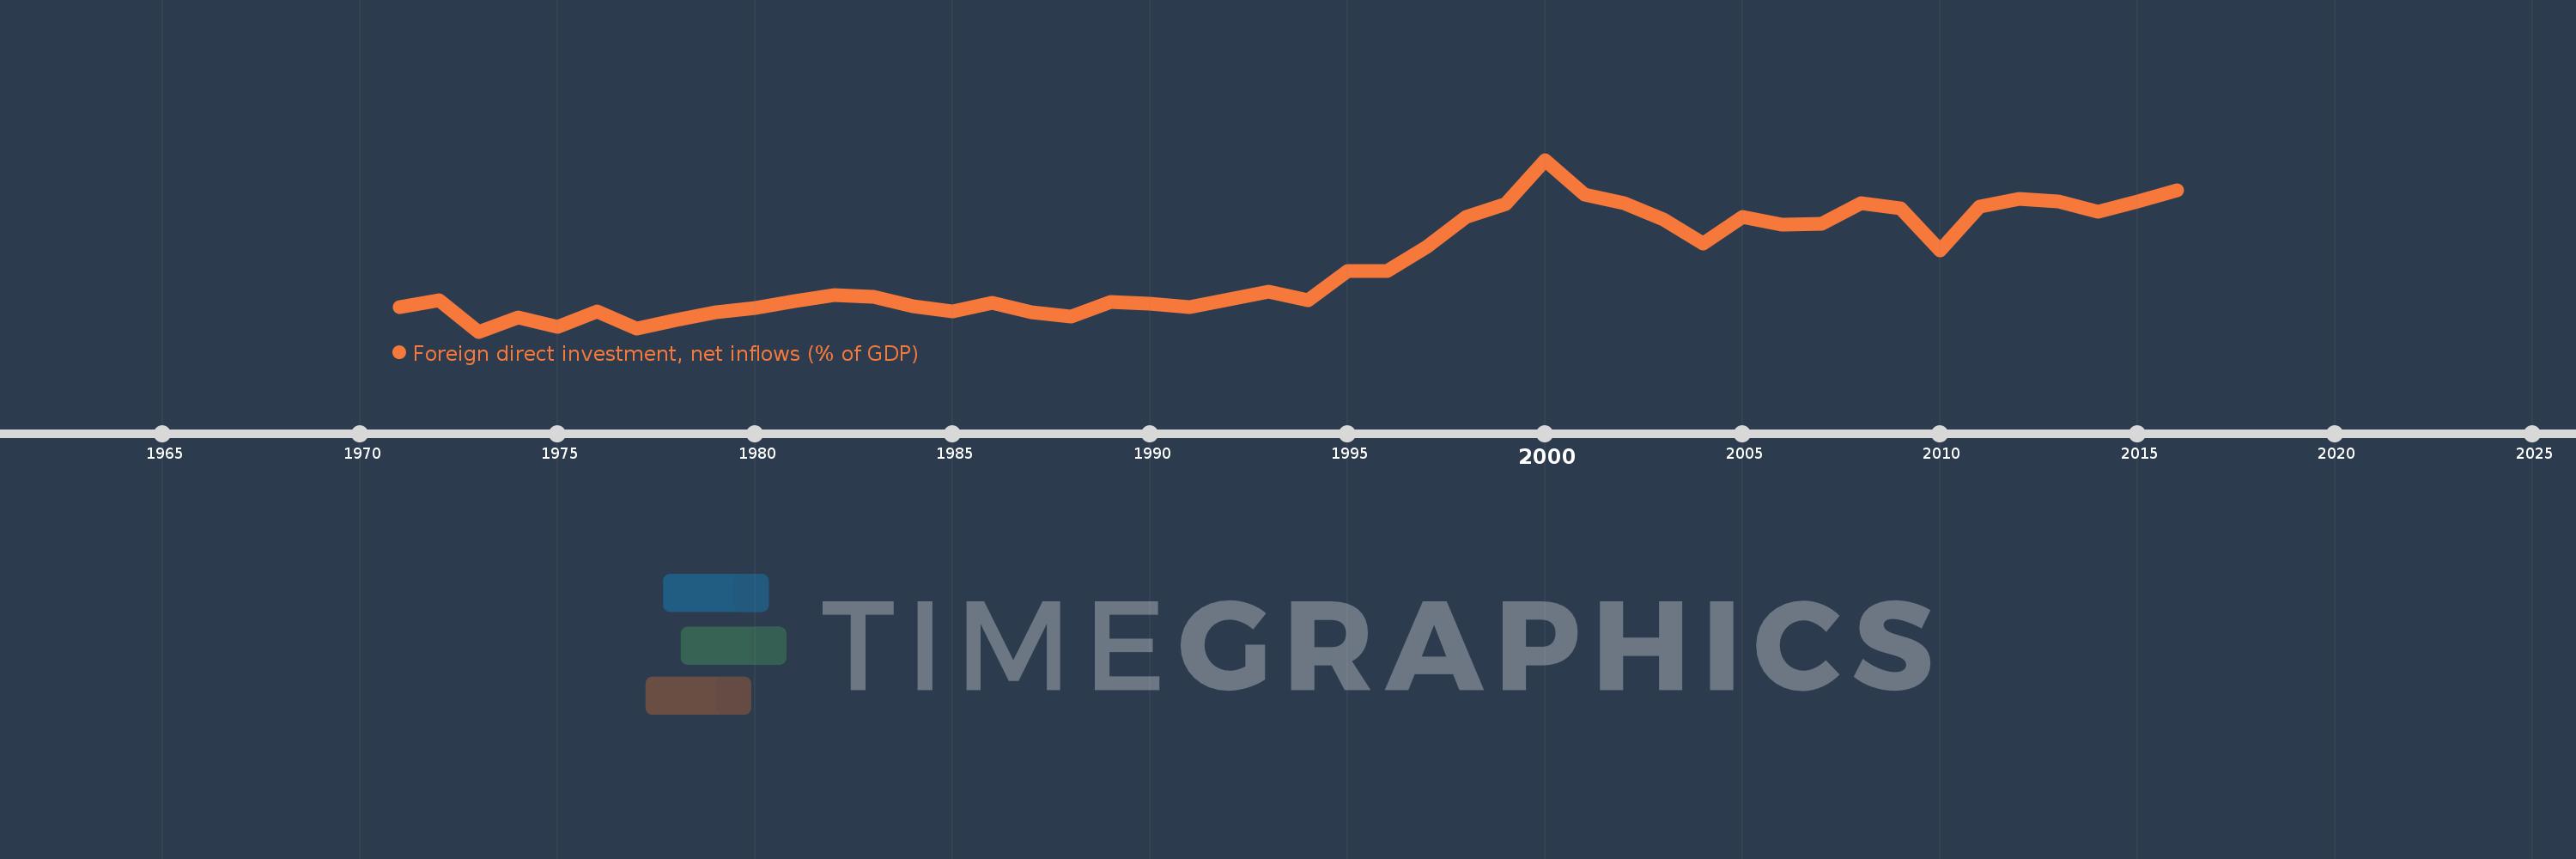
Foreign direct investment, net inflows (% of GDP)
2016,2015,2014,2013,2012,2011,2010,2009,2008,2007,2006,2005,2004,2003,2002,2001,2000,1999,1998,1997,1996,1995,1994,1993,1992,1991,1990,1989,1988,1987,1986,1985,1984,1983,1982,1981,1980,1979,1978,1977,1976,1975,1974,1973,1972,1971
This statistics in other country:
AfghanistanAlbaniaAlgeriaAngolaAntigua and BarbudaArab WorldArgentinaArmeniaArubaAustraliaAustriaAzerbaijanBahamas, TheBahrainBangladeshBarbadosBelarusBelgiumBelizeBeninBermudaBhutanBoliviaBosnia and HerzegovinaBotswanaBrazilBrunei DarussalamBulgariaBurkina FasoBurundiCabo VerdeCambodiaCameroonCanadaCaribbean small statesCayman IslandsCentral African RepublicCentral Europe and the BalticsChadChileChinaColombiaComorosCongo, Dem. Rep.Congo, Rep.Costa RicaCote d'IvoireCroatiaCyprusCzech RepublicDenmarkDjiboutiDominicaDominican RepublicEarly-demographic dividendEast Asia & PacificEast Asia & Pacific (excluding high income)East Asia & Pacific (IDA & IBRD countries)EcuadorEgypt, Arab Rep.El SalvadorEquatorial GuineaEritreaEstoniaEthiopiaEuro areaEurope & Central AsiaEurope & Central Asia (excluding high income)Europe & Central Asia (IDA & IBRD countries)European UnionFijiFinlandFragile and conflict affected situationsFranceFrench PolynesiaGabonGambia, TheGeorgiaGermanyGhanaGreeceGrenadaGuatemalaGuineaGuinea-BissauGuyanaHaitiHeavily indebted poor countries (HIPC)High incomeHondurasHong Kong SAR, ChinaHungaryIBRD onlyIcelandIDA & IBRD totalIDA blendIDA onlyIDA totalIndiaIndonesiaIran, Islamic Rep.IraqIrelandIsraelItalyJamaicaJapanJordanKazakhstanKenyaKiribatiKorea, Rep.KosovoKuwaitKyrgyz RepublicLao PDRLate-demographic dividendLatin America & Caribbean Latin America & Caribbean (excluding high income)Latin America & the Caribbean (IDA & IBRD countries)LatviaLeast developed countries: UN classificationLebanonLesothoLiberiaLibyaLithuaniaLow & middle incomeLow incomeLower middle incomeLuxembourgMacao SAR, ChinaMacedonia, FYRMadagascarMalawiMalaysiaMaldivesMaliMaltaMarshall IslandsMauritaniaMauritiusMexicoMicronesia, Fed. Sts.Middle East & North AfricaMiddle East & North Africa (excluding high income)Middle East & North Africa (IDA & IBRD countries)Middle incomeMoldovaMongoliaMontenegroMoroccoMozambiqueMyanmarNamibiaNauruNepalNetherlandsNew CaledoniaNew ZealandNicaraguaNigerNigeriaNorth AmericaNorwayOECD membersOmanOther small statesPacific island small statesPakistanPalauPanamaPapua New GuineaParaguayPeruPhilippinesPolandPortugalPost-demographic dividendPre-demographic dividendQatarRomaniaRussian FederationRwandaSamoaSao Tome and PrincipeSaudi ArabiaSenegalSerbiaSeychellesSierra LeoneSingaporeSlovak RepublicSloveniaSmall statesSolomon IslandsSomaliaSouth AfricaSouth AsiaSouth Asia (IDA & IBRD)South SudanSpainSri LankaSt. Kitts and NevisSt. LuciaSt. Vincent and the GrenadinesSub-Saharan Africa Sub-Saharan Africa (excluding high income)Sub-Saharan Africa (IDA & IBRD countries)SudanSurinameSwazilandSwedenSwitzerlandSyrian Arab RepublicTajikistanTanzaniaThailandTimor-LesteTogoTongaTrinidad and TobagoTunisiaTurkeyTurkmenistanTuvaluUgandaUkraineUnited Arab EmiratesUnited KingdomUnited StatesUpper middle incomeUruguayUzbekistanVanuatuVenezuela, RBVietnamWest Bank and GazaWorldYemen, Rep.ZambiaZimbabwe Timeline:
This timeline shows a graph from 1971 to 2016 of Latin America & Caribbean . No data until 1970. Number of actual observations by date: 46.
Source name:
World Development Indicators
Source organization:
International Monetary Fund, International Financial Statistics and Balance of Payments databases, World Bank, International Debt Statistics, and World Bank and OECD GDP estimates.
Categories, topics:
Economy & Growth, Financial Sector, Climate Change
Last updated:
apr 23, 2017
Indicators value changes by year
At the date of observation
Value
Absolute change
Change from previous value
jan 1, 1971
0.732
+0.732
0.0%
jan 1, 1972
0.911
+0.179
24.52%
jan 1, 1973
0.099
-0.812
-89.14%
jan 1, 1974
0.477
+0.378
381.72%
jan 1, 1975
0.222
-0.254
-53.36%
jan 1, 1976
0.625
+0.403
181.13%
jan 1, 1977
0.167
-0.458
-73.28%
jan 1, 1978
0.39
+0.223
133.86%
jan 1, 1979
0.594
+0.204
52.22%
jan 1, 1980
0.717
+0.122
20.6%
jan 1, 1981
0.899
+0.182
25.46%
jan 1, 1982
1.049
+0.15
16.64%
jan 1, 1983
1.006
-0.043
-4.13%
jan 1, 1984
0.769
-0.237
-23.52%
jan 1, 1985
0.624
-0.145
-18.84%
jan 1, 1986
0.854
+0.23
36.8%
jan 1, 1987
0.611
-0.243
-28.49%
jan 1, 1988
0.5
-0.11
-18.05%
jan 1, 1989
0.875
+0.374
74.83%
jan 1, 1990
0.825
-0.05
-5.74%
jan 1, 1991
0.745
-0.08
-9.71%
jan 1, 1992
0.943
+0.198
26.63%
jan 1, 1993
1.143
+0.201
21.27%
jan 1, 1994
0.926
-0.218
-19.04%
jan 1, 1995
1.67
+0.744
80.38%
jan 1, 1996
1.67
+0.001
0.03%
jan 1, 1997
2.302
+0.631
37.81%
jan 1, 1998
3.093
+0.791
34.37%
jan 1, 1999
3.424
+0.332
10.73%
jan 1, 2000
4.572
+1.147
33.51%
jan 1, 2001
3.668
-0.904
-19.77%
jan 1, 2002
3.451
-0.217
-5.92%
jan 1, 2003
3.011
-0.439
-12.73%
jan 1, 2004
2.383
-0.628
-20.86%
jan 1, 2005
3.086
+0.703
29.49%
jan 1, 2006
2.876
-0.211
-6.82%
jan 1, 2007
2.913
+0.037
1.29%
jan 1, 2008
3.453
+0.541
18.56%
jan 1, 2009
3.304
-0.15
-4.33%
jan 1, 2010
2.205
-1.099
-33.26%
jan 1, 2011
3.352
+1.146
51.99%
jan 1, 2012
3.561
+0.209
6.25%
jan 1, 2013
3.478
-0.083
-2.33%
jan 1, 2014
3.218
-0.26
-7.48%
jan 1, 2015
3.494
+0.276
8.58%
jan 1, 2016
3.778
+0.284
8.12%
Ranking of countries by current statistics by years


Comments: