29
/
en
AIzaSyAYiBZKx7MnpbEhh9jyipgxe19OcubqV5w
April 1, 2024
147932
Guyana
GUY
true
2
1
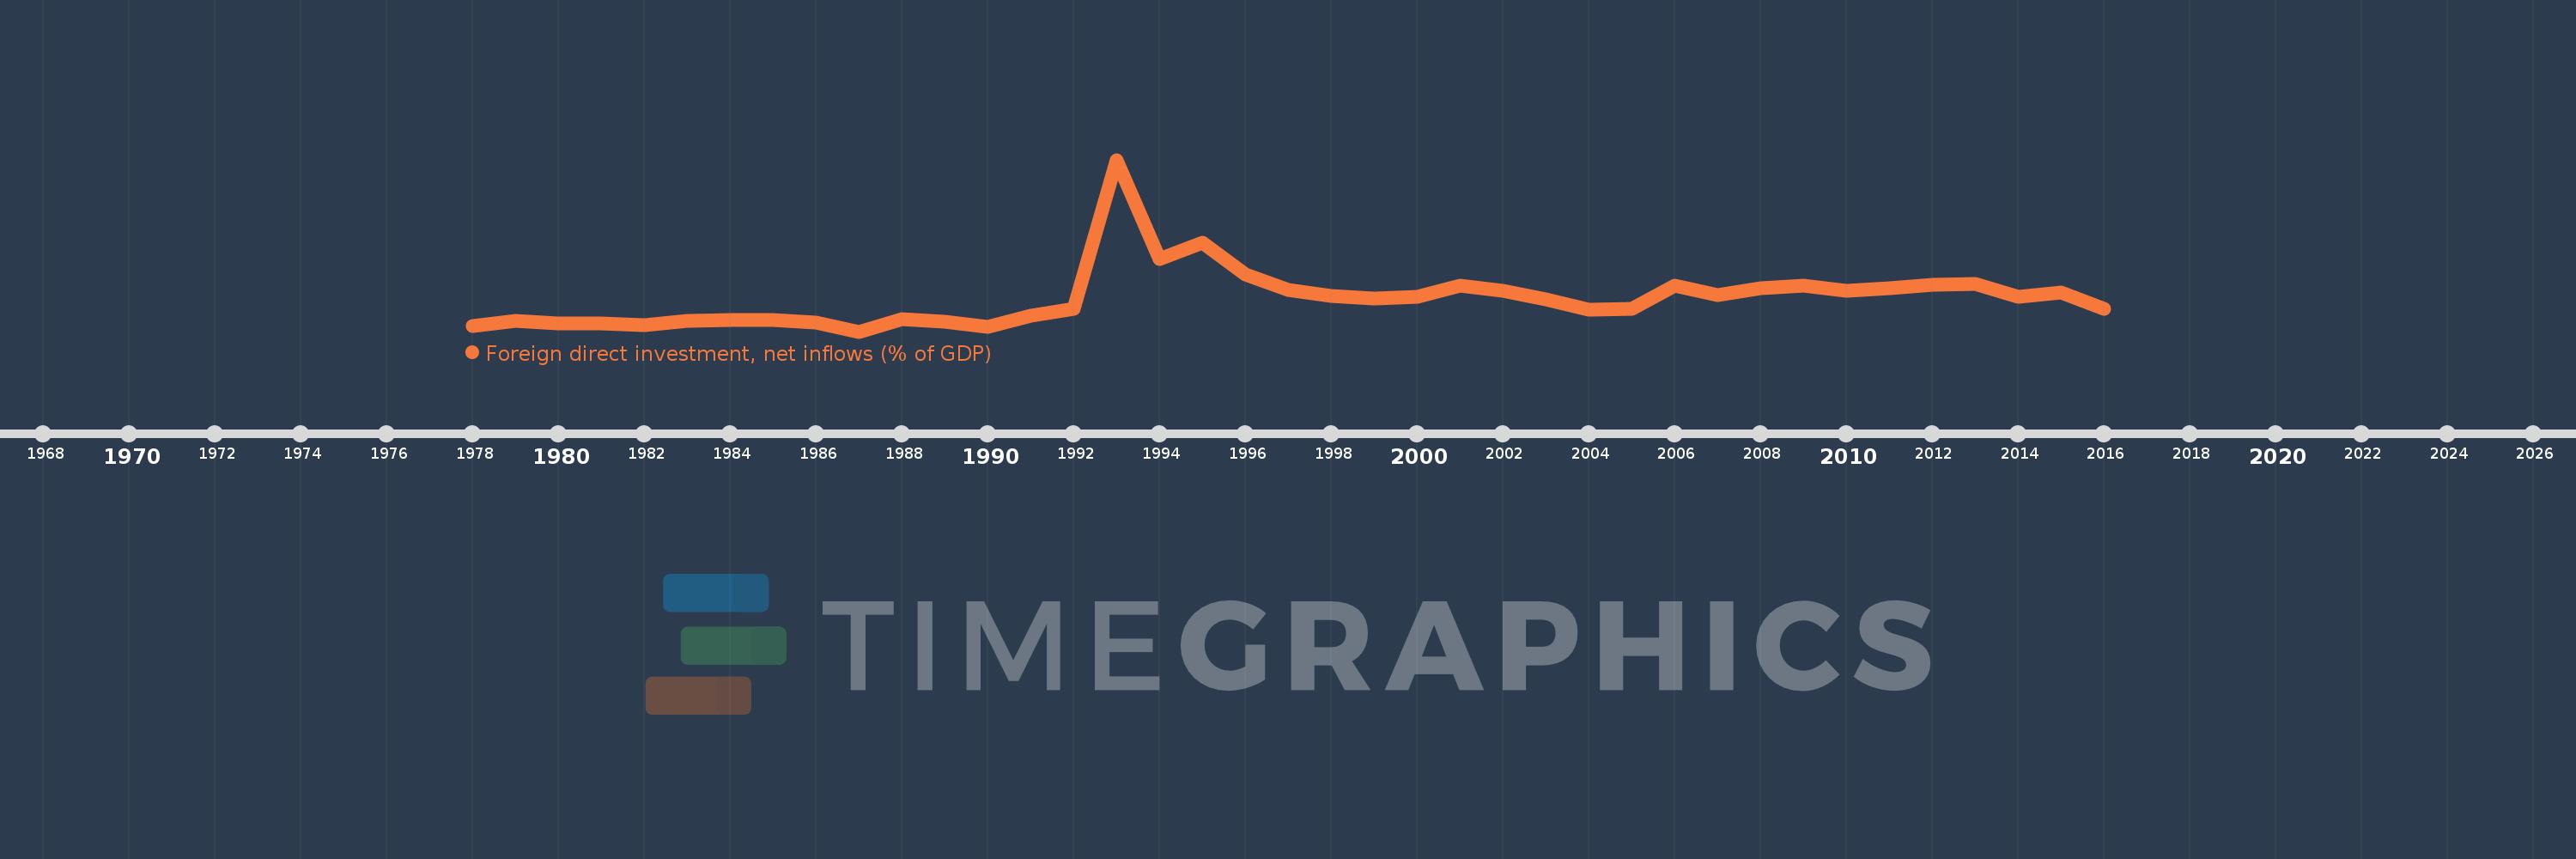
Foreign direct investment, net inflows (% of GDP)
2016,2015,2014,2013,2012,2011,2010,2009,2008,2007,2006,2005,2004,2003,2002,2001,2000,1999,1998,1997,1996,1995,1994,1993,1992,1991,1990,1989,1988,1987,1986,1985,1984,1983,1982,1981,1980,1979,1978
This statistics in other country:
AfghanistanAlbaniaAlgeriaAngolaAntigua and BarbudaArab WorldArgentinaArmeniaArubaAustraliaAustriaAzerbaijanBahamas, TheBahrainBangladeshBarbadosBelarusBelgiumBelizeBeninBermudaBhutanBoliviaBosnia and HerzegovinaBotswanaBrazilBrunei DarussalamBulgariaBurkina FasoBurundiCabo VerdeCambodiaCameroonCanadaCaribbean small statesCayman IslandsCentral African RepublicCentral Europe and the BalticsChadChileChinaColombiaComorosCongo, Dem. Rep.Congo, Rep.Costa RicaCote d'IvoireCroatiaCyprusCzech RepublicDenmarkDjiboutiDominicaDominican RepublicEarly-demographic dividendEast Asia & PacificEast Asia & Pacific (excluding high income)East Asia & Pacific (IDA & IBRD countries)EcuadorEgypt, Arab Rep.El SalvadorEquatorial GuineaEritreaEstoniaEthiopiaEuro areaEurope & Central AsiaEurope & Central Asia (excluding high income)Europe & Central Asia (IDA & IBRD countries)European UnionFijiFinlandFragile and conflict affected situationsFranceFrench PolynesiaGabonGambia, TheGeorgiaGermanyGhanaGreeceGrenadaGuatemalaGuineaGuinea-BissauGuyanaHaitiHeavily indebted poor countries (HIPC)High incomeHondurasHong Kong SAR, ChinaHungaryIBRD onlyIcelandIDA & IBRD totalIDA blendIDA onlyIDA totalIndiaIndonesiaIran, Islamic Rep.IraqIrelandIsraelItalyJamaicaJapanJordanKazakhstanKenyaKiribatiKorea, Rep.KosovoKuwaitKyrgyz RepublicLao PDRLate-demographic dividendLatin America & Caribbean Latin America & Caribbean (excluding high income)Latin America & the Caribbean (IDA & IBRD countries)LatviaLeast developed countries: UN classificationLebanonLesothoLiberiaLibyaLithuaniaLow & middle incomeLow incomeLower middle incomeLuxembourgMacao SAR, ChinaMacedonia, FYRMadagascarMalawiMalaysiaMaldivesMaliMaltaMarshall IslandsMauritaniaMauritiusMexicoMicronesia, Fed. Sts.Middle East & North AfricaMiddle East & North Africa (excluding high income)Middle East & North Africa (IDA & IBRD countries)Middle incomeMoldovaMongoliaMontenegroMoroccoMozambiqueMyanmarNamibiaNauruNepalNetherlandsNew CaledoniaNew ZealandNicaraguaNigerNigeriaNorth AmericaNorwayOECD membersOmanOther small statesPacific island small statesPakistanPalauPanamaPapua New GuineaParaguayPeruPhilippinesPolandPortugalPost-demographic dividendPre-demographic dividendQatarRomaniaRussian FederationRwandaSamoaSao Tome and PrincipeSaudi ArabiaSenegalSerbiaSeychellesSierra LeoneSingaporeSlovak RepublicSloveniaSmall statesSolomon IslandsSomaliaSouth AfricaSouth AsiaSouth Asia (IDA & IBRD)South SudanSpainSri LankaSt. Kitts and NevisSt. LuciaSt. Vincent and the GrenadinesSub-Saharan Africa Sub-Saharan Africa (excluding high income)Sub-Saharan Africa (IDA & IBRD countries)SudanSurinameSwazilandSwedenSwitzerlandSyrian Arab RepublicTajikistanTanzaniaThailandTimor-LesteTogoTongaTrinidad and TobagoTunisiaTurkeyTurkmenistanTuvaluUgandaUkraineUnited Arab EmiratesUnited KingdomUnited StatesUpper middle incomeUruguayUzbekistanVanuatuVenezuela, RBVietnamWest Bank and GazaWorldYemen, Rep.ZambiaZimbabwe Timeline:
This timeline shows a graph from 1978 to 2016 of Guyana. No data until 1977. Number of actual observations by date: 39.
Source name:
World Development Indicators
Source organization:
International Monetary Fund, International Financial Statistics and Balance of Payments databases, World Bank, International Debt Statistics, and World Bank and OECD GDP estimates.
Categories, topics:
Economy & Growth, Financial Sector, Climate Change
Last updated:
apr 23, 2017
Indicators value changes by year
Minimum:
-1.783
jan 1, 1987
Maximum:
39.809
jan 1, 1993
At the date of observation
Value
Absolute change
Change from previous value
jan 1, 1978
-0.392
-0.392
0.0%
jan 1, 1979
0.793
+1.185
-302.1%
jan 1, 1980
0.111
-0.682
-86.01%
jan 1, 1981
0.098
-0.013
-12.06%
jan 1, 1982
-0.312
-0.409
-419.63%
jan 1, 1983
0.92
+1.231
-395.09%
jan 1, 1984
0.967
+0.048
5.17%
jan 1, 1985
1.026
+0.058
6.04%
jan 1, 1986
0.399
-0.626
-61.07%
jan 1, 1987
-1.783
-2.183
-546.59%
jan 1, 1988
1.227
+3.01
-168.79%
jan 1, 1989
0.507
-0.719
-58.63%
jan 1, 1990
-0.542
-1.05
-206.88%
jan 1, 1991
1.992
+2.534
-467.25%
jan 1, 1992
3.665
+1.673
83.98%
jan 1, 1993
39.809
+36.144
986.23%
jan 1, 1994
15.723
-24.086
-60.5%
jan 1, 1995
19.725
+4.002
25.45%
jan 1, 1996
11.972
-7.754
-39.31%
jan 1, 1997
8.364
-3.608
-30.14%
jan 1, 1998
6.941
-1.423
-17.01%
jan 1, 1999
6.132
-0.809
-11.66%
jan 1, 2000
6.621
+0.489
7.97%
jan 1, 2001
9.415
+2.794
42.2%
jan 1, 2002
8.043
-1.373
-14.58%
jan 1, 2003
6.035
-2.008
-24.96%
jan 1, 2004
3.518
-2.517
-41.71%
jan 1, 2005
3.817
+0.299
8.51%
jan 1, 2006
9.31
+5.493
143.91%
jan 1, 2007
7.021
-2.289
-24.59%
jan 1, 2008
8.757
+1.736
24.72%
jan 1, 2009
9.258
+0.501
5.73%
jan 1, 2010
8.097
-1.162
-12.55%
jan 1, 2011
8.764
+0.667
8.24%
jan 1, 2012
9.579
+0.815
9.3%
jan 1, 2013
9.747
+0.169
1.76%
jan 1, 2014
6.708
-3.04
-31.18%
jan 1, 2015
7.726
+1.019
15.19%
jan 1, 2016
3.694
-4.032
-52.19%
Ranking of countries by current statistics by years


Comments: