29
/
en
AIzaSyAYiBZKx7MnpbEhh9jyipgxe19OcubqV5w
April 1, 2024
209297
New Zealand
NZL
true
2
1
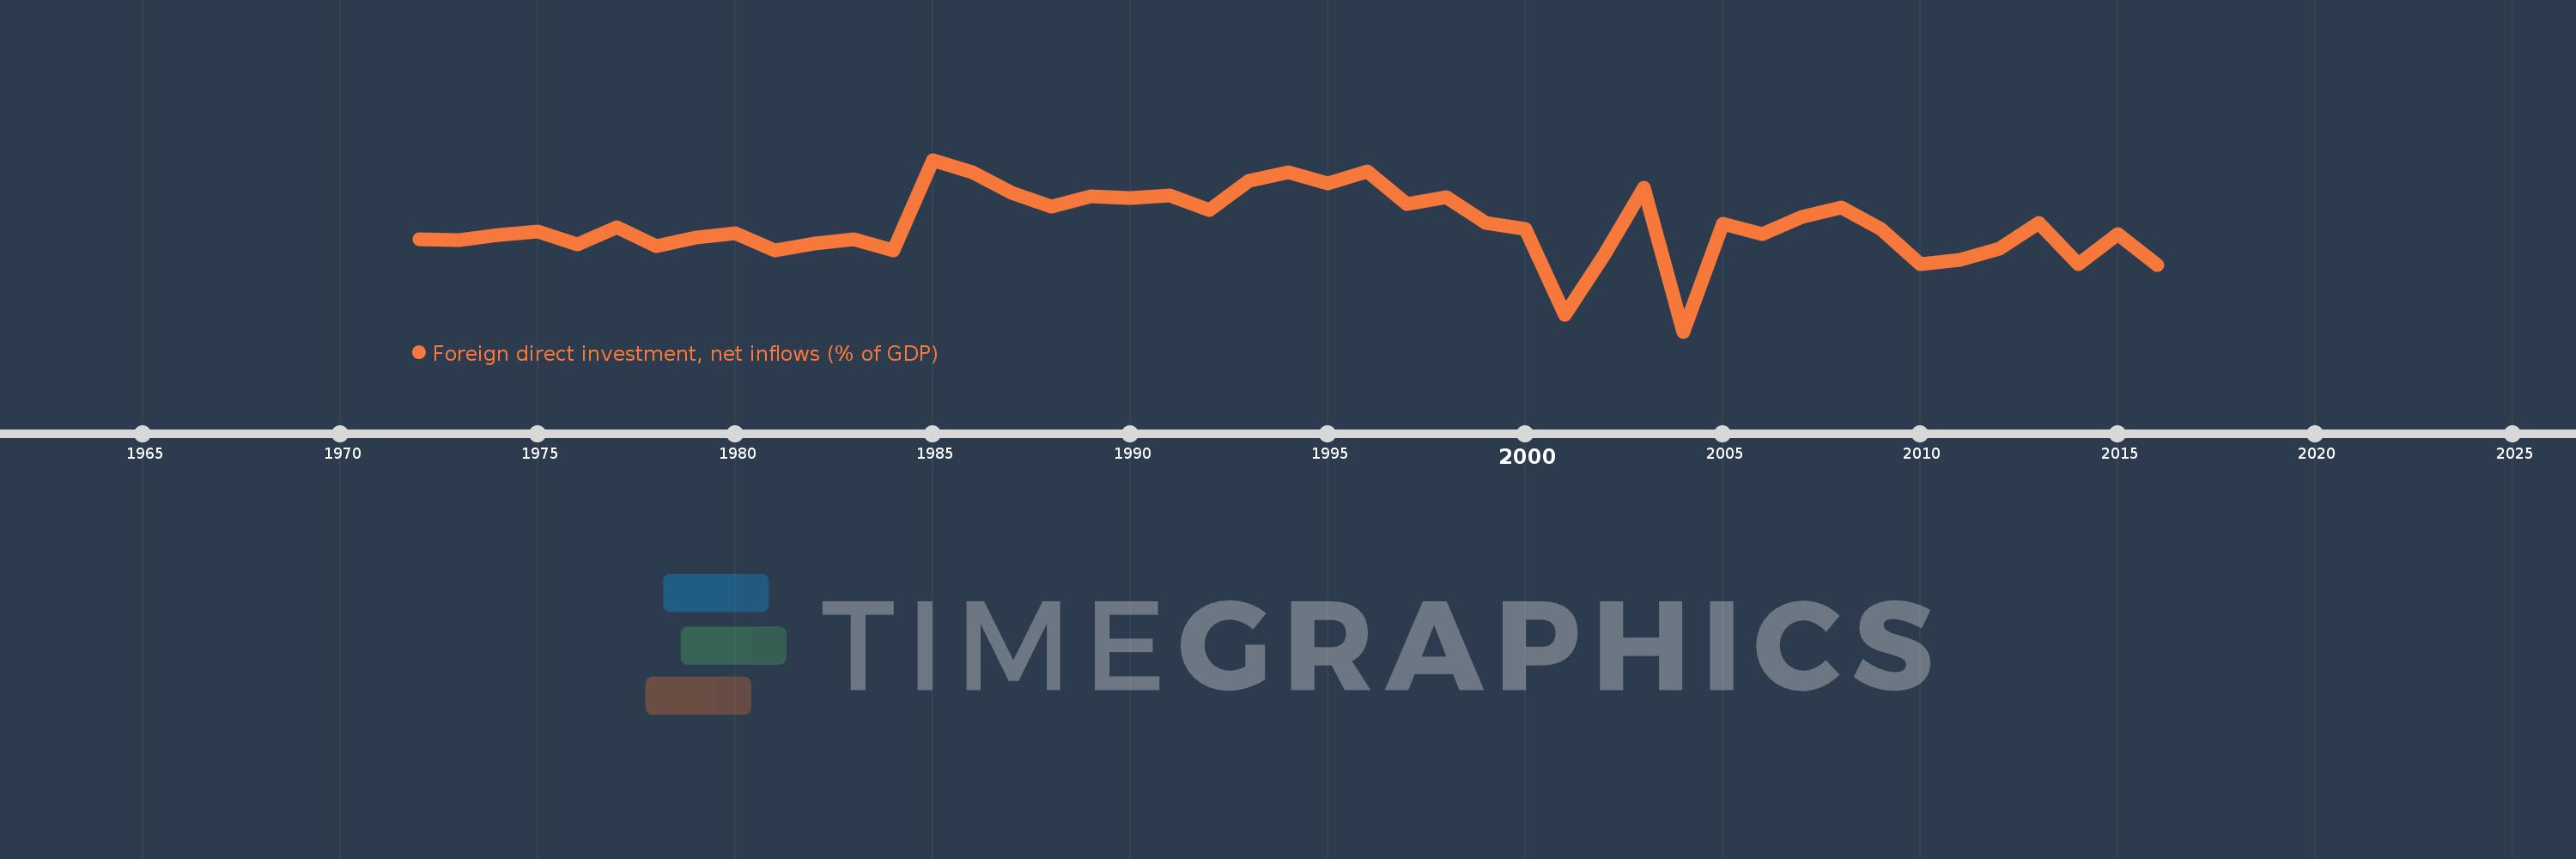
Foreign direct investment, net inflows (% of GDP)
2016,2015,2014,2013,2012,2011,2010,2009,2008,2007,2006,2005,2004,2003,2002,2001,2000,1999,1998,1997,1996,1995,1994,1993,1992,1991,1990,1989,1988,1987,1986,1985,1984,1983,1982,1981,1980,1979,1978,1977,1976,1975,1974,1973,1972
This statistics in other country:
AfghanistanAlbaniaAlgeriaAngolaAntigua and BarbudaArab WorldArgentinaArmeniaArubaAustraliaAustriaAzerbaijanBahamas, TheBahrainBangladeshBarbadosBelarusBelgiumBelizeBeninBermudaBhutanBoliviaBosnia and HerzegovinaBotswanaBrazilBrunei DarussalamBulgariaBurkina FasoBurundiCabo VerdeCambodiaCameroonCanadaCaribbean small statesCayman IslandsCentral African RepublicCentral Europe and the BalticsChadChileChinaColombiaComorosCongo, Dem. Rep.Congo, Rep.Costa RicaCote d'IvoireCroatiaCyprusCzech RepublicDenmarkDjiboutiDominicaDominican RepublicEarly-demographic dividendEast Asia & PacificEast Asia & Pacific (excluding high income)East Asia & Pacific (IDA & IBRD countries)EcuadorEgypt, Arab Rep.El SalvadorEquatorial GuineaEritreaEstoniaEthiopiaEuro areaEurope & Central AsiaEurope & Central Asia (excluding high income)Europe & Central Asia (IDA & IBRD countries)European UnionFijiFinlandFragile and conflict affected situationsFranceFrench PolynesiaGabonGambia, TheGeorgiaGermanyGhanaGreeceGrenadaGuatemalaGuineaGuinea-BissauGuyanaHaitiHeavily indebted poor countries (HIPC)High incomeHondurasHong Kong SAR, ChinaHungaryIBRD onlyIcelandIDA & IBRD totalIDA blendIDA onlyIDA totalIndiaIndonesiaIran, Islamic Rep.IraqIrelandIsraelItalyJamaicaJapanJordanKazakhstanKenyaKiribatiKorea, Rep.KosovoKuwaitKyrgyz RepublicLao PDRLate-demographic dividendLatin America & Caribbean Latin America & Caribbean (excluding high income)Latin America & the Caribbean (IDA & IBRD countries)LatviaLeast developed countries: UN classificationLebanonLesothoLiberiaLibyaLithuaniaLow & middle incomeLow incomeLower middle incomeLuxembourgMacao SAR, ChinaMacedonia, FYRMadagascarMalawiMalaysiaMaldivesMaliMaltaMarshall IslandsMauritaniaMauritiusMexicoMicronesia, Fed. Sts.Middle East & North AfricaMiddle East & North Africa (excluding high income)Middle East & North Africa (IDA & IBRD countries)Middle incomeMoldovaMongoliaMontenegroMoroccoMozambiqueMyanmarNamibiaNauruNepalNetherlandsNew CaledoniaNew ZealandNicaraguaNigerNigeriaNorth AmericaNorwayOECD membersOmanOther small statesPacific island small statesPakistanPalauPanamaPapua New GuineaParaguayPeruPhilippinesPolandPortugalPost-demographic dividendPre-demographic dividendQatarRomaniaRussian FederationRwandaSamoaSao Tome and PrincipeSaudi ArabiaSenegalSerbiaSeychellesSierra LeoneSingaporeSlovak RepublicSloveniaSmall statesSolomon IslandsSomaliaSouth AfricaSouth AsiaSouth Asia (IDA & IBRD)South SudanSpainSri LankaSt. Kitts and NevisSt. LuciaSt. Vincent and the GrenadinesSub-Saharan Africa Sub-Saharan Africa (excluding high income)Sub-Saharan Africa (IDA & IBRD countries)SudanSurinameSwazilandSwedenSwitzerlandSyrian Arab RepublicTajikistanTanzaniaThailandTimor-LesteTogoTongaTrinidad and TobagoTunisiaTurkeyTurkmenistanTuvaluUgandaUkraineUnited Arab EmiratesUnited KingdomUnited StatesUpper middle incomeUruguayUzbekistanVanuatuVenezuela, RBVietnamWest Bank and GazaWorldYemen, Rep.ZambiaZimbabwe Timeline:
This timeline shows a graph from 1972 to 2016 of New Zealand. No data until 1971. Number of actual observations by date: 45.
Source name:
World Development Indicators
Source organization:
International Monetary Fund, International Financial Statistics and Balance of Payments databases, World Bank, International Debt Statistics, and World Bank and OECD GDP estimates.
Categories, topics:
Economy & Growth, Financial Sector, Climate Change
Last updated:
apr 23, 2017
Indicators value changes by year
Minimum:
-3.812
jan 1, 2004
At the date of observation
Value
Absolute change
Change from previous value
jan 1, 1972
1.39
+1.39
0.0%
jan 1, 1973
1.324
-0.066
-4.75%
jan 1, 1974
1.622
+0.298
22.49%
jan 1, 1975
1.805
+0.183
11.28%
jan 1, 1976
1.074
-0.731
-40.48%
jan 1, 1977
2.041
+0.967
89.97%
jan 1, 1978
0.999
-1.042
-51.04%
jan 1, 1979
1.477
+0.478
47.86%
jan 1, 1980
1.691
+0.214
14.46%
jan 1, 1981
0.767
-0.924
-54.65%
jan 1, 1982
1.125
+0.358
46.67%
jan 1, 1983
1.356
+0.231
20.55%
jan 1, 1984
0.72
-0.636
-46.92%
jan 1, 1985
5.829
+5.109
709.99%
jan 1, 1986
5.128
-0.701
-12.03%
jan 1, 1987
3.966
-1.162
-22.66%
jan 1, 1988
3.18
-0.785
-19.8%
jan 1, 1989
3.802
+0.621
19.53%
jan 1, 1990
3.705
-0.097
-2.55%
jan 1, 1991
3.814
+0.109
2.94%
jan 1, 1992
3.017
-0.796
-20.88%
jan 1, 1993
4.644
+1.626
53.9%
jan 1, 1994
5.122
+0.478
10.3%
jan 1, 1995
4.513
-0.61
-11.9%
jan 1, 1996
5.189
+0.676
14.98%
jan 1, 1997
3.333
-1.856
-35.77%
jan 1, 1998
3.733
+0.4
12.01%
jan 1, 1999
2.282
-1.451
-38.87%
jan 1, 2000
1.95
-0.332
-14.55%
jan 1, 2001
-2.865
-4.815
-246.96%
jan 1, 2002
0.481
+3.347
-116.8%
jan 1, 2003
4.275
+3.794
788.17%
jan 1, 2004
-3.812
-8.087
-189.16%
jan 1, 2005
2.233
+6.044
-158.57%
jan 1, 2006
1.662
-0.571
-25.56%
jan 1, 2007
2.61
+0.948
57.02%
jan 1, 2008
3.157
+0.548
20.98%
jan 1, 2009
1.945
-1.213
-38.41%
jan 1, 2010
-0.043
-1.988
-102.22%
jan 1, 2011
0.195
+0.238
-552.4%
jan 1, 2012
0.818
+0.623
318.92%
jan 1, 2013
2.267
+1.449
177.08%
jan 1, 2014
-0.036
-2.304
-101.61%
jan 1, 2015
1.647
+1.683
-4.62K%
jan 1, 2016
-0.078
-1.724
-104.72%
Ranking of countries by current statistics by years


Comments: