29
/
en
AIzaSyAYiBZKx7MnpbEhh9jyipgxe19OcubqV5w
April 1, 2024
139250
Germany
DEU
true
2
1
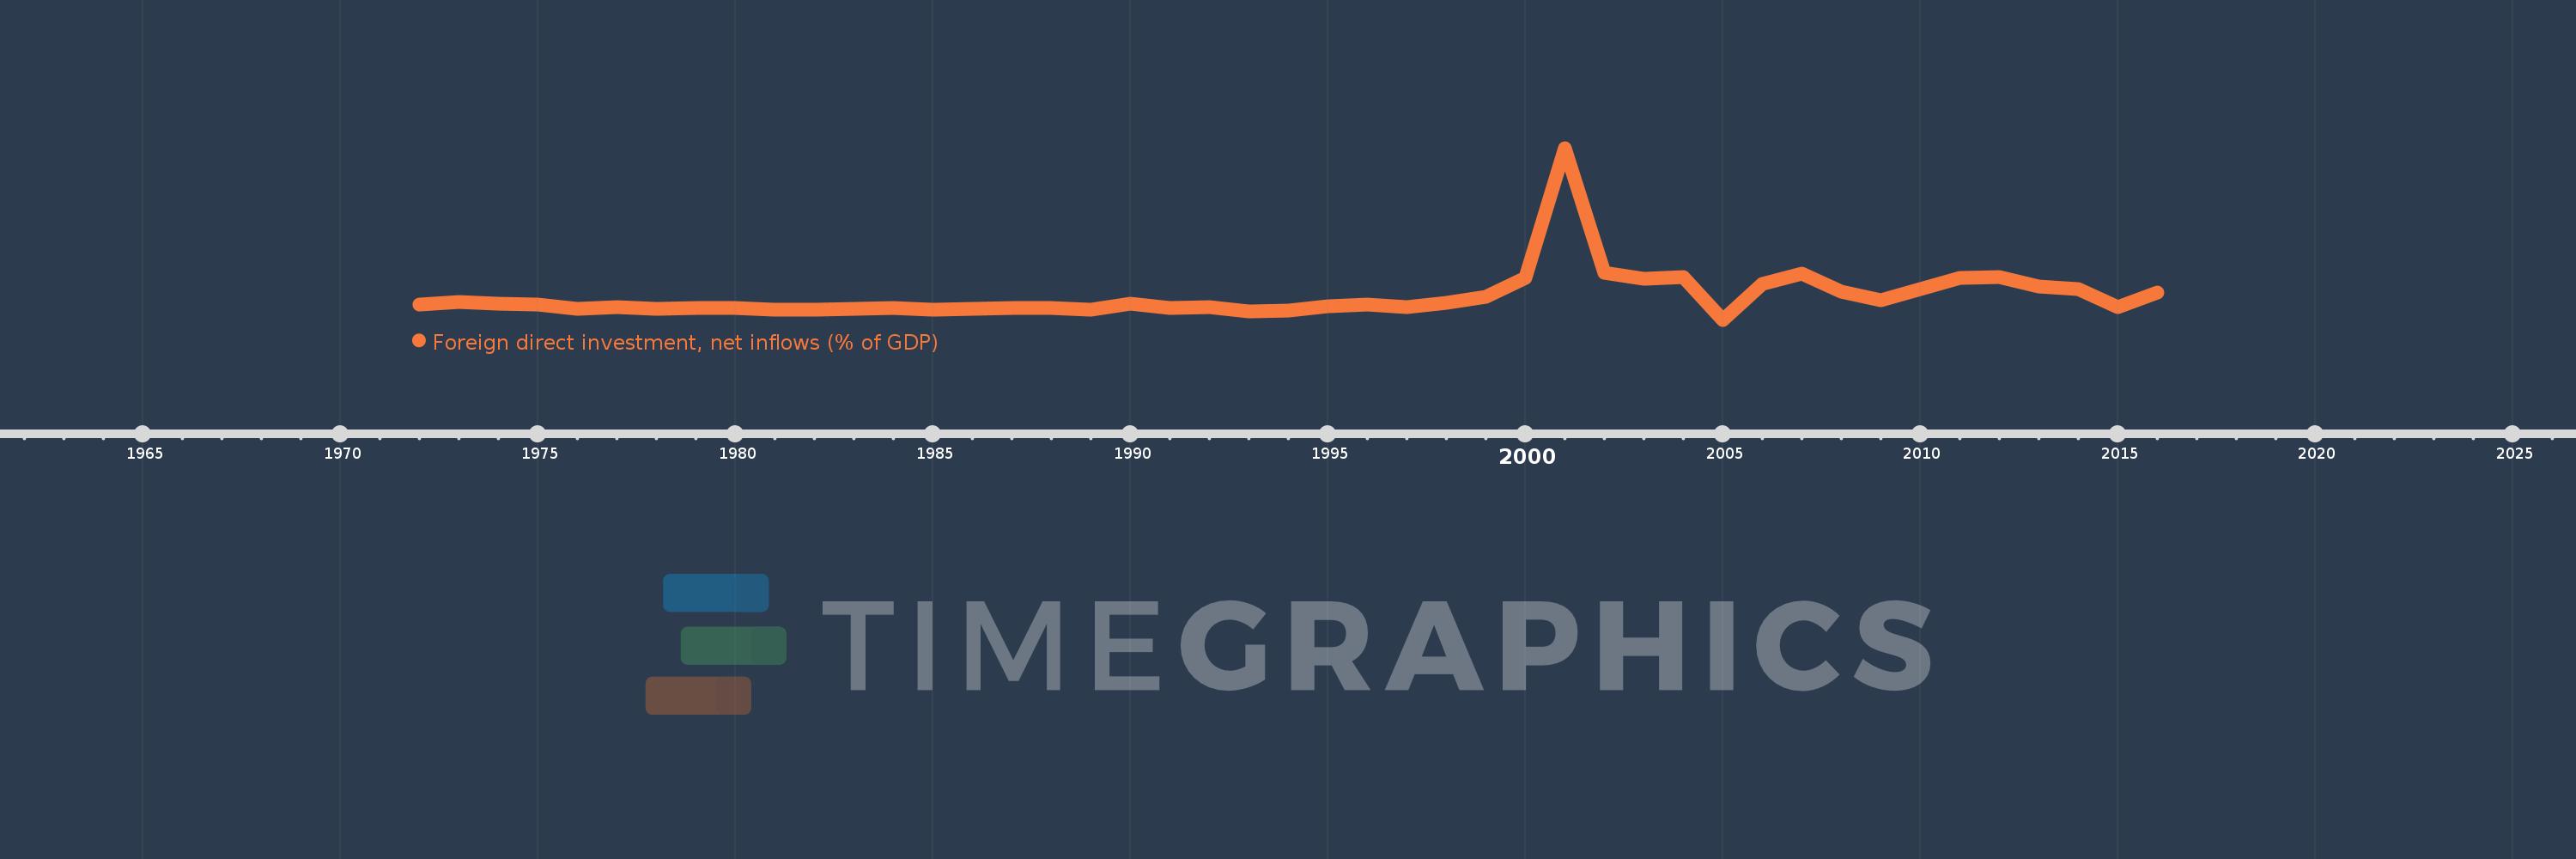
Foreign direct investment, net inflows (% of GDP)
2016,2015,2014,2013,2012,2011,2010,2009,2008,2007,2006,2005,2004,2003,2002,2001,2000,1999,1998,1997,1996,1995,1994,1993,1992,1991,1990,1989,1988,1987,1986,1985,1984,1983,1982,1981,1980,1979,1978,1977,1976,1975,1974,1973,1972
This statistics in other country:
AfghanistanAlbaniaAlgeriaAngolaAntigua and BarbudaArab WorldArgentinaArmeniaArubaAustraliaAustriaAzerbaijanBahamas, TheBahrainBangladeshBarbadosBelarusBelgiumBelizeBeninBermudaBhutanBoliviaBosnia and HerzegovinaBotswanaBrazilBrunei DarussalamBulgariaBurkina FasoBurundiCabo VerdeCambodiaCameroonCanadaCaribbean small statesCayman IslandsCentral African RepublicCentral Europe and the BalticsChadChileChinaColombiaComorosCongo, Dem. Rep.Congo, Rep.Costa RicaCote d'IvoireCroatiaCyprusCzech RepublicDenmarkDjiboutiDominicaDominican RepublicEarly-demographic dividendEast Asia & PacificEast Asia & Pacific (excluding high income)East Asia & Pacific (IDA & IBRD countries)EcuadorEgypt, Arab Rep.El SalvadorEquatorial GuineaEritreaEstoniaEthiopiaEuro areaEurope & Central AsiaEurope & Central Asia (excluding high income)Europe & Central Asia (IDA & IBRD countries)European UnionFijiFinlandFragile and conflict affected situationsFranceFrench PolynesiaGabonGambia, TheGeorgiaGermanyGhanaGreeceGrenadaGuatemalaGuineaGuinea-BissauGuyanaHaitiHeavily indebted poor countries (HIPC)High incomeHondurasHong Kong SAR, ChinaHungaryIBRD onlyIcelandIDA & IBRD totalIDA blendIDA onlyIDA totalIndiaIndonesiaIran, Islamic Rep.IraqIrelandIsraelItalyJamaicaJapanJordanKazakhstanKenyaKiribatiKorea, Rep.KosovoKuwaitKyrgyz RepublicLao PDRLate-demographic dividendLatin America & Caribbean Latin America & Caribbean (excluding high income)Latin America & the Caribbean (IDA & IBRD countries)LatviaLeast developed countries: UN classificationLebanonLesothoLiberiaLibyaLithuaniaLow & middle incomeLow incomeLower middle incomeLuxembourgMacao SAR, ChinaMacedonia, FYRMadagascarMalawiMalaysiaMaldivesMaliMaltaMarshall IslandsMauritaniaMauritiusMexicoMicronesia, Fed. Sts.Middle East & North AfricaMiddle East & North Africa (excluding high income)Middle East & North Africa (IDA & IBRD countries)Middle incomeMoldovaMongoliaMontenegroMoroccoMozambiqueMyanmarNamibiaNauruNepalNetherlandsNew CaledoniaNew ZealandNicaraguaNigerNigeriaNorth AmericaNorwayOECD membersOmanOther small statesPacific island small statesPakistanPalauPanamaPapua New GuineaParaguayPeruPhilippinesPolandPortugalPost-demographic dividendPre-demographic dividendQatarRomaniaRussian FederationRwandaSamoaSao Tome and PrincipeSaudi ArabiaSenegalSerbiaSeychellesSierra LeoneSingaporeSlovak RepublicSloveniaSmall statesSolomon IslandsSomaliaSouth AfricaSouth AsiaSouth Asia (IDA & IBRD)South SudanSpainSri LankaSt. Kitts and NevisSt. LuciaSt. Vincent and the GrenadinesSub-Saharan Africa Sub-Saharan Africa (excluding high income)Sub-Saharan Africa (IDA & IBRD countries)SudanSurinameSwazilandSwedenSwitzerlandSyrian Arab RepublicTajikistanTanzaniaThailandTimor-LesteTogoTongaTrinidad and TobagoTunisiaTurkeyTurkmenistanTuvaluUgandaUkraineUnited Arab EmiratesUnited KingdomUnited StatesUpper middle incomeUruguayUzbekistanVanuatuVenezuela, RBVietnamWest Bank and GazaWorldYemen, Rep.ZambiaZimbabwe Timeline:
This timeline shows a graph from 1972 to 2016 of Germany. No data until 1971. Number of actual observations by date: 45.
Source name:
World Development Indicators
Source organization:
International Monetary Fund, International Financial Statistics and Balance of Payments databases, World Bank, International Debt Statistics, and World Bank and OECD GDP estimates.
Categories, topics:
Economy & Growth, Financial Sector, Climate Change
Last updated:
apr 23, 2017
Indicators value changes by year
Minimum:
-0.725
jan 1, 2005
Maximum:
12.718
jan 1, 2001
At the date of observation
Value
Absolute change
Change from previous value
jan 1, 1972
0.443
+0.443
0.0%
jan 1, 1973
0.635
+0.192
43.38%
jan 1, 1974
0.53
-0.106
-16.61%
jan 1, 1975
0.491
-0.039
-7.36%
jan 1, 1976
0.141
-0.349
-71.21%
jan 1, 1977
0.255
+0.114
80.64%
jan 1, 1978
0.159
-0.096
-37.77%
jan 1, 1979
0.217
+0.059
36.88%
jan 1, 1980
0.197
-0.02
-9.22%
jan 1, 1981
0.036
-0.161
-81.67%
jan 1, 1982
0.04
+0.004
10.94%
jan 1, 1983
0.098
+0.058
145.03%
jan 1, 1984
0.225
+0.126
128.37%
jan 1, 1985
0.073
-0.151
-67.33%
jan 1, 1986
0.113
+0.039
53.45%
jan 1, 1987
0.215
+0.102
91.03%
jan 1, 1988
0.164
-0.051
-23.82%
jan 1, 1989
0.076
-0.088
-53.44%
jan 1, 1990
0.503
+0.427
559.8%
jan 1, 1991
0.17
-0.333
-66.18%
jan 1, 1992
0.255
+0.085
49.84%
jan 1, 1993
-0.1
-0.355
-139.1%
jan 1, 1994
0.019
+0.119
-119.46%
jan 1, 1995
0.33
+0.311
1.6K%
jan 1, 1996
0.462
+0.132
39.94%
jan 1, 1997
0.257
-0.206
-44.47%
jan 1, 1998
0.577
+0.32
124.6%
jan 1, 1999
1.054
+0.477
82.69%
jan 1, 2000
2.541
+1.488
141.19%
jan 1, 2001
12.718
+10.176
400.44%
jan 1, 2002
2.919
-9.799
-77.05%
jan 1, 2003
2.464
-0.455
-15.59%
jan 1, 2004
2.608
+0.144
5.86%
jan 1, 2005
-0.725
-3.333
-127.81%
jan 1, 2006
2.092
+2.817
-388.45%
jan 1, 2007
2.912
+0.821
39.23%
jan 1, 2008
1.478
-1.434
-49.25%
jan 1, 2009
0.824
-0.654
-44.24%
jan 1, 2010
1.658
+0.834
101.16%
jan 1, 2011
2.518
+0.86
51.89%
jan 1, 2012
2.594
+0.076
3.02%
jan 1, 2013
1.847
-0.747
-28.8%
jan 1, 2014
1.671
-0.176
-9.53%
jan 1, 2015
0.243
-1.428
-85.43%
jan 1, 2016
1.374
+1.131
464.51%
Ranking of countries by current statistics by years


Comments: