29
/
en
AIzaSyAYiBZKx7MnpbEhh9jyipgxe19OcubqV5w
April 1, 2024
110917
Congo, Rep.
COG
true
2
1
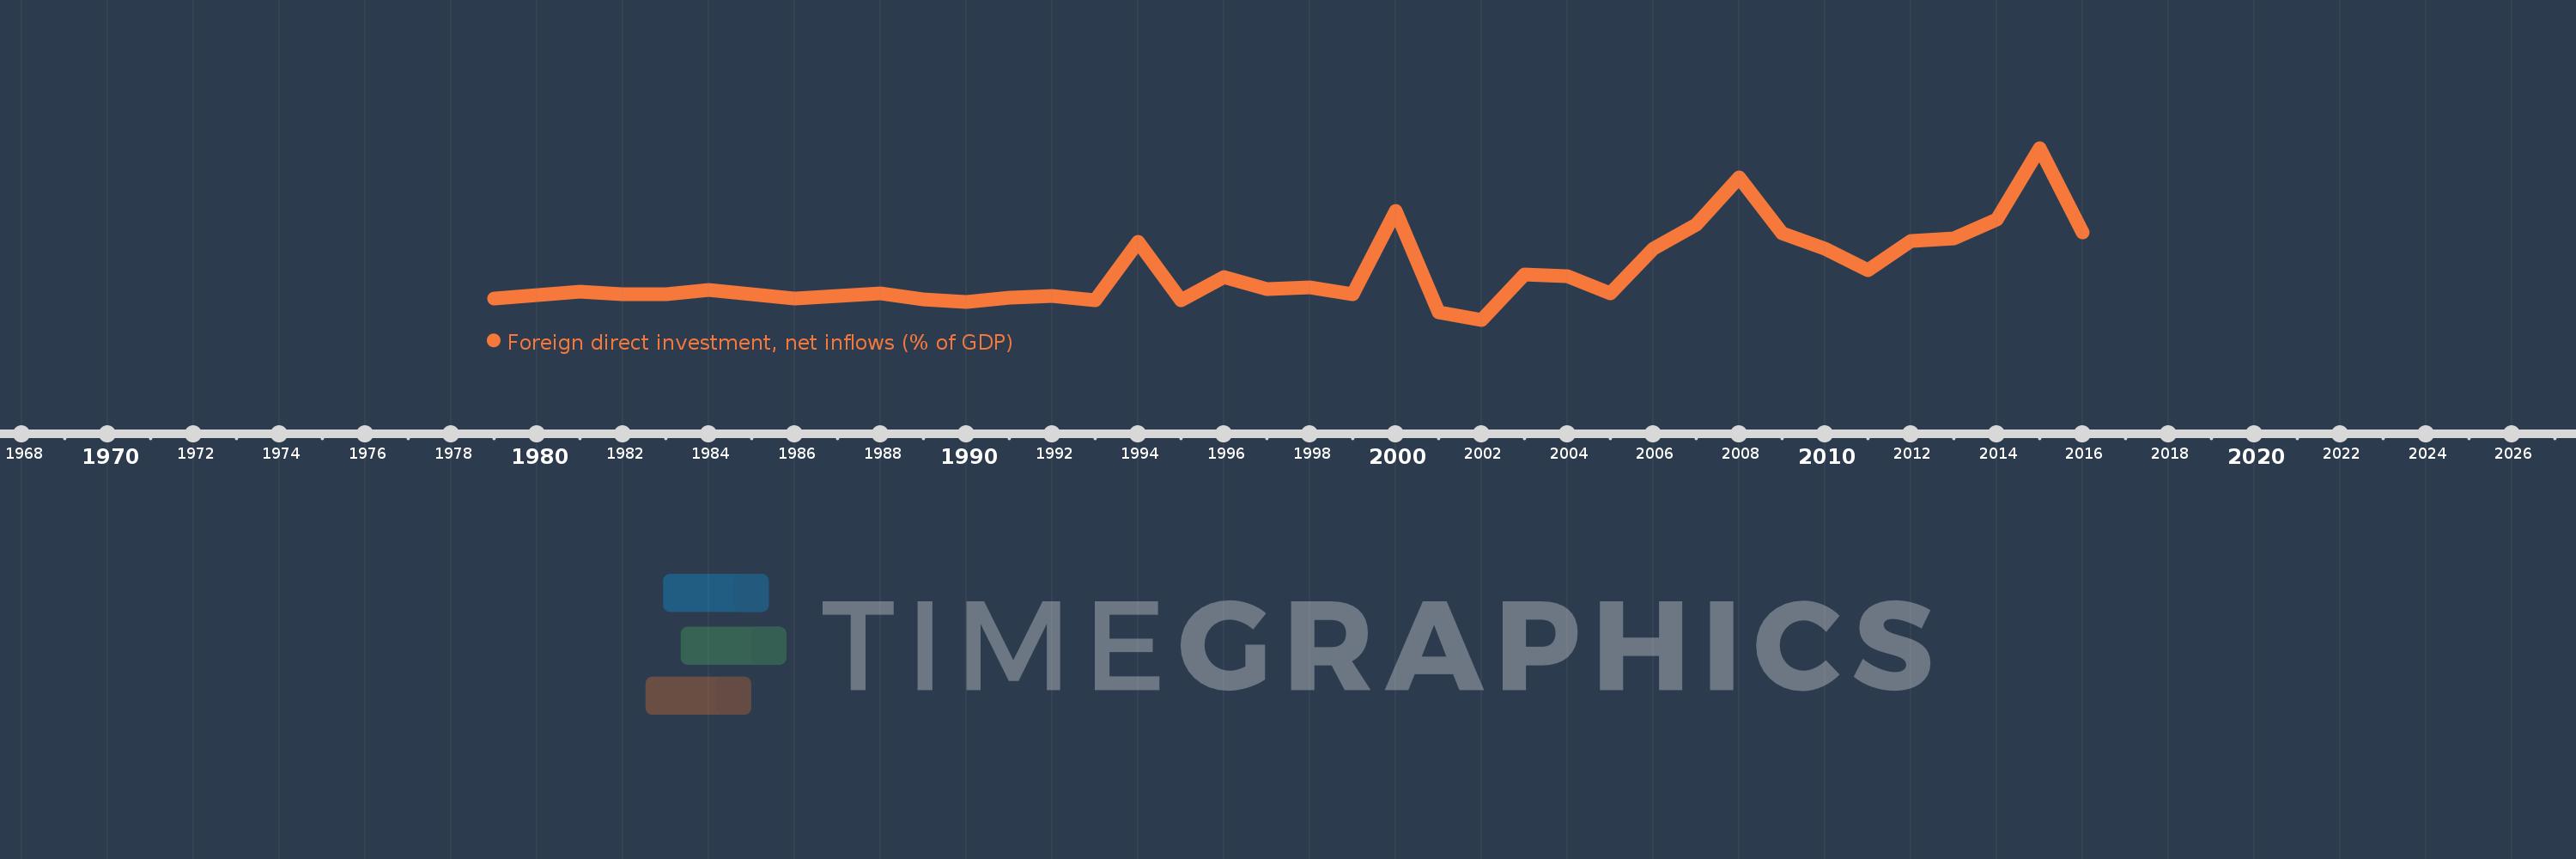
Foreign direct investment, net inflows (% of GDP)
2016,2015,2014,2013,2012,2011,2010,2009,2008,2007,2006,2005,2004,2003,2002,2001,2000,1999,1998,1997,1996,1995,1994,1993,1992,1991,1990,1989,1988,1987,1986,1985,1984,1983,1982,1981,1980,1979
This statistics in other country:
AfghanistanAlbaniaAlgeriaAngolaAntigua and BarbudaArab WorldArgentinaArmeniaArubaAustraliaAustriaAzerbaijanBahamas, TheBahrainBangladeshBarbadosBelarusBelgiumBelizeBeninBermudaBhutanBoliviaBosnia and HerzegovinaBotswanaBrazilBrunei DarussalamBulgariaBurkina FasoBurundiCabo VerdeCambodiaCameroonCanadaCaribbean small statesCayman IslandsCentral African RepublicCentral Europe and the BalticsChadChileChinaColombiaComorosCongo, Dem. Rep.Congo, Rep.Costa RicaCote d'IvoireCroatiaCyprusCzech RepublicDenmarkDjiboutiDominicaDominican RepublicEarly-demographic dividendEast Asia & PacificEast Asia & Pacific (excluding high income)East Asia & Pacific (IDA & IBRD countries)EcuadorEgypt, Arab Rep.El SalvadorEquatorial GuineaEritreaEstoniaEthiopiaEuro areaEurope & Central AsiaEurope & Central Asia (excluding high income)Europe & Central Asia (IDA & IBRD countries)European UnionFijiFinlandFragile and conflict affected situationsFranceFrench PolynesiaGabonGambia, TheGeorgiaGermanyGhanaGreeceGrenadaGuatemalaGuineaGuinea-BissauGuyanaHaitiHeavily indebted poor countries (HIPC)High incomeHondurasHong Kong SAR, ChinaHungaryIBRD onlyIcelandIDA & IBRD totalIDA blendIDA onlyIDA totalIndiaIndonesiaIran, Islamic Rep.IraqIrelandIsraelItalyJamaicaJapanJordanKazakhstanKenyaKiribatiKorea, Rep.KosovoKuwaitKyrgyz RepublicLao PDRLate-demographic dividendLatin America & Caribbean Latin America & Caribbean (excluding high income)Latin America & the Caribbean (IDA & IBRD countries)LatviaLeast developed countries: UN classificationLebanonLesothoLiberiaLibyaLithuaniaLow & middle incomeLow incomeLower middle incomeLuxembourgMacao SAR, ChinaMacedonia, FYRMadagascarMalawiMalaysiaMaldivesMaliMaltaMarshall IslandsMauritaniaMauritiusMexicoMicronesia, Fed. Sts.Middle East & North AfricaMiddle East & North Africa (excluding high income)Middle East & North Africa (IDA & IBRD countries)Middle incomeMoldovaMongoliaMontenegroMoroccoMozambiqueMyanmarNamibiaNauruNepalNetherlandsNew CaledoniaNew ZealandNicaraguaNigerNigeriaNorth AmericaNorwayOECD membersOmanOther small statesPacific island small statesPakistanPalauPanamaPapua New GuineaParaguayPeruPhilippinesPolandPortugalPost-demographic dividendPre-demographic dividendQatarRomaniaRussian FederationRwandaSamoaSao Tome and PrincipeSaudi ArabiaSenegalSerbiaSeychellesSierra LeoneSingaporeSlovak RepublicSloveniaSmall statesSolomon IslandsSomaliaSouth AfricaSouth AsiaSouth Asia (IDA & IBRD)South SudanSpainSri LankaSt. Kitts and NevisSt. LuciaSt. Vincent and the GrenadinesSub-Saharan Africa Sub-Saharan Africa (excluding high income)Sub-Saharan Africa (IDA & IBRD countries)SudanSurinameSwazilandSwedenSwitzerlandSyrian Arab RepublicTajikistanTanzaniaThailandTimor-LesteTogoTongaTrinidad and TobagoTunisiaTurkeyTurkmenistanTuvaluUgandaUkraineUnited Arab EmiratesUnited KingdomUnited StatesUpper middle incomeUruguayUzbekistanVanuatuVenezuela, RBVietnamWest Bank and GazaWorldYemen, Rep.ZambiaZimbabwe Timeline:
This timeline shows a graph from 1979 to 2016 of Congo, Rep.. No data until 1978. Number of actual observations by date: 38.
Source name:
World Development Indicators
Source organization:
International Monetary Fund, International Financial Statistics and Balance of Payments databases, World Bank, International Debt Statistics, and World Bank and OECD GDP estimates.
Categories, topics:
Economy & Growth, Financial Sector, Climate Change
Last updated:
apr 23, 2017
Indicators value changes by year
Minimum:
-4.844
jan 1, 2002
At the date of observation
Value
Absolute change
Change from previous value
jan 1, 1979
0.461
+0.461
0.0%
jan 1, 1980
1.375
+0.914
198.3%
jan 1, 1981
2.347
+0.972
70.69%
jan 1, 1982
1.547
-0.8
-34.07%
jan 1, 1983
1.636
+0.089
5.75%
jan 1, 1984
2.674
+1.038
63.44%
jan 1, 1985
1.593
-1.081
-40.42%
jan 1, 1986
0.587
-1.006
-63.14%
jan 1, 1987
1.213
+0.626
106.63%
jan 1, 1988
1.891
+0.677
55.83%
jan 1, 1989
0.411
-1.48
-78.26%
jan 1, 1990
-0.298
-0.709
-172.54%
jan 1, 1991
0.806
+1.104
-370.23%
jan 1, 1992
1.202
+0.396
49.18%
jan 1, 1993
0.093
-1.109
-92.23%
jan 1, 1994
14.907
+14.813
15.86K%
jan 1, 1995
0.169
-14.738
-98.87%
jan 1, 1996
5.908
+5.739
3.4K%
jan 1, 1997
2.857
-3.052
-51.65%
jan 1, 1998
3.409
+0.552
19.32%
jan 1, 1999
1.681
-1.727
-50.67%
jan 1, 2000
22.865
+21.183
1.26K%
jan 1, 2001
-3.04
-25.905
-113.3%
jan 1, 2002
-4.844
-1.804
59.33%
jan 1, 2003
6.595
+11.439
-236.13%
jan 1, 2004
6.28
-0.314
-4.77%
jan 1, 2005
1.902
-4.379
-69.72%
jan 1, 2006
13.159
+11.258
592.0%
jan 1, 2007
19.243
+6.083
46.23%
jan 1, 2008
31.429
+12.187
63.33%
jan 1, 2009
17.134
-14.296
-45.49%
jan 1, 2010
13.278
-3.856
-22.5%
jan 1, 2011
7.732
-5.546
-41.77%
jan 1, 2012
15.111
+7.379
95.44%
jan 1, 2013
15.733
+0.622
4.11%
jan 1, 2014
20.687
+4.954
31.49%
jan 1, 2015
38.81
+18.123
87.61%
jan 1, 2016
17.376
-21.434
-55.23%
Ranking of countries by current statistics by years


Comments: