29
/
en
AIzaSyAYiBZKx7MnpbEhh9jyipgxe19OcubqV5w
April 1, 2024
164822
Jordan
JOR
true
2
1
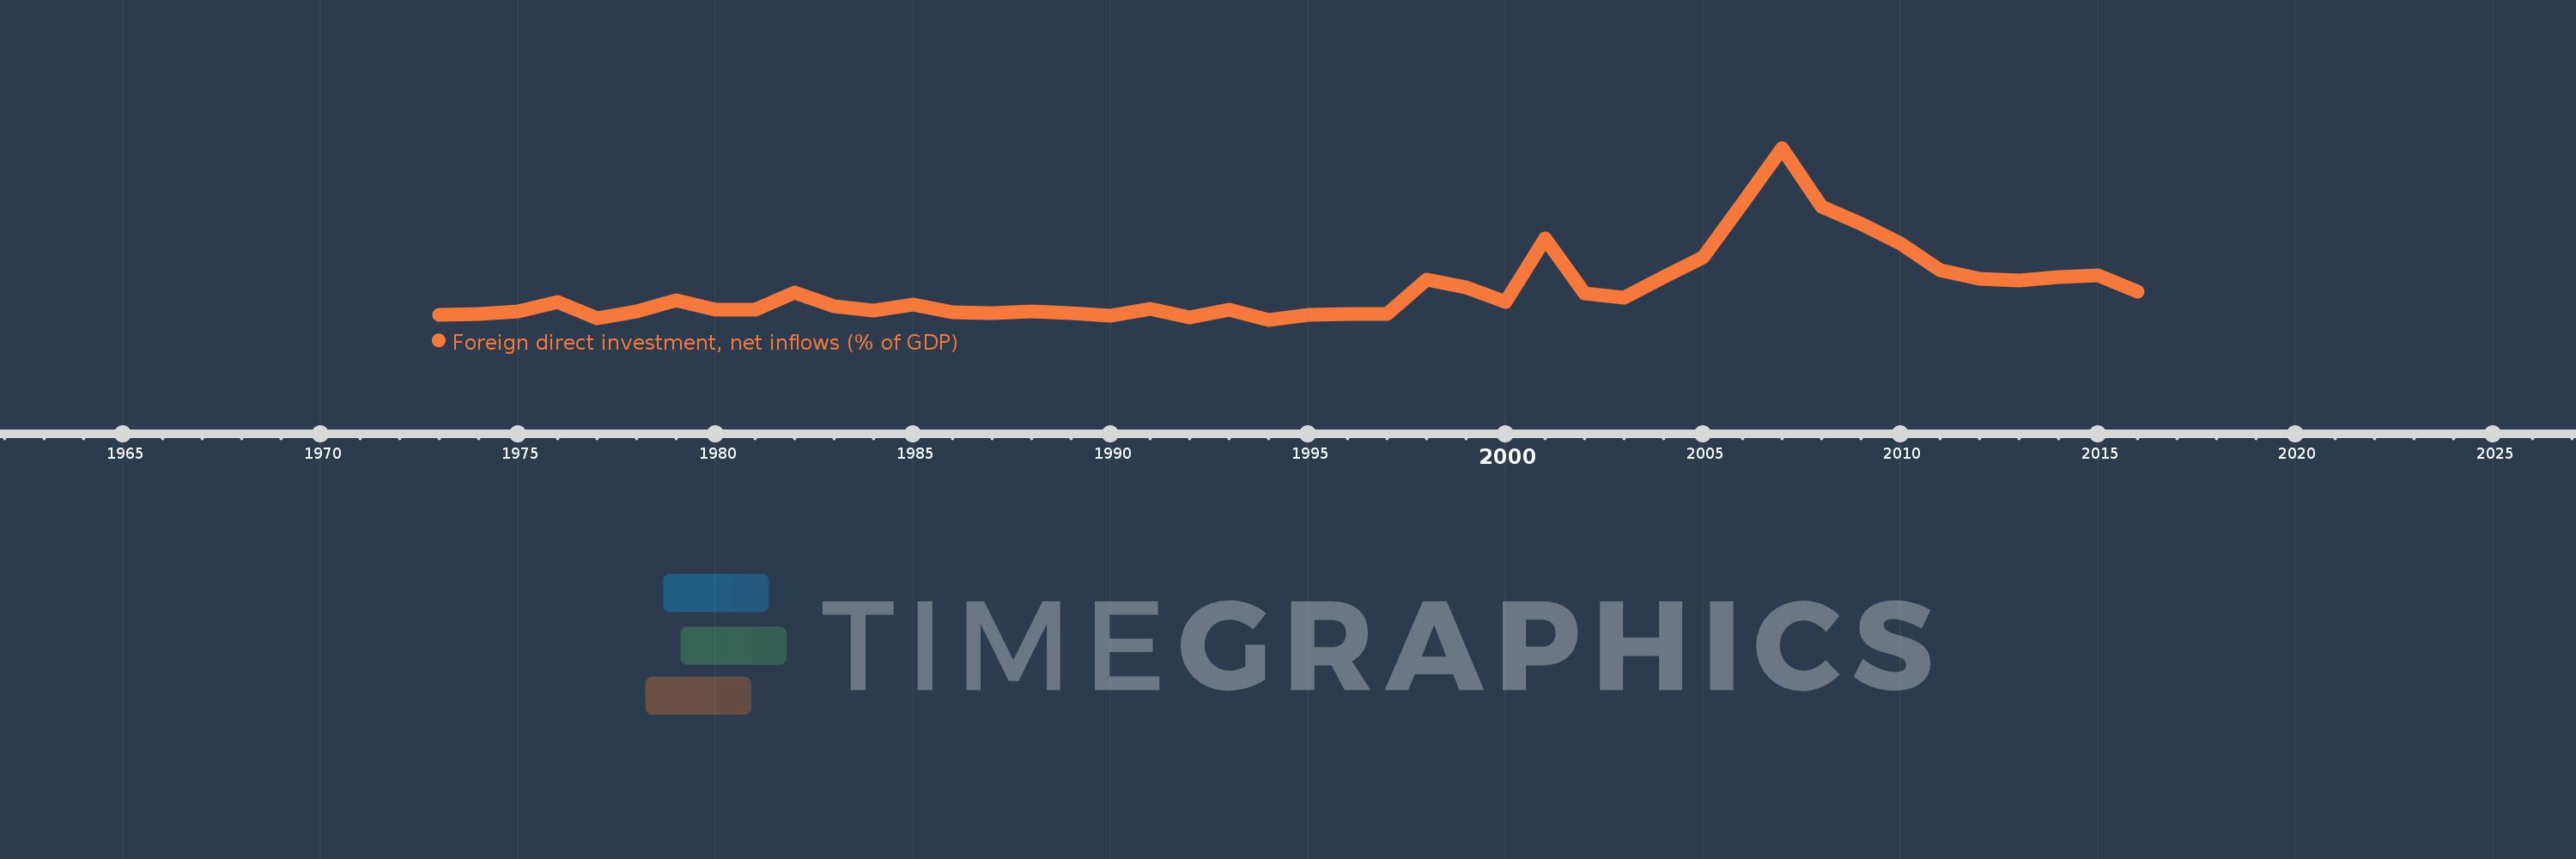
Foreign direct investment, net inflows (% of GDP)
2016,2015,2014,2013,2012,2011,2010,2009,2008,2007,2006,2005,2004,2003,2002,2001,2000,1999,1998,1997,1996,1995,1994,1993,1992,1991,1990,1989,1988,1987,1986,1985,1984,1983,1982,1981,1980,1979,1978,1977,1976,1975,1974,1973
This statistics in other country:
AfghanistanAlbaniaAlgeriaAngolaAntigua and BarbudaArab WorldArgentinaArmeniaArubaAustraliaAustriaAzerbaijanBahamas, TheBahrainBangladeshBarbadosBelarusBelgiumBelizeBeninBermudaBhutanBoliviaBosnia and HerzegovinaBotswanaBrazilBrunei DarussalamBulgariaBurkina FasoBurundiCabo VerdeCambodiaCameroonCanadaCaribbean small statesCayman IslandsCentral African RepublicCentral Europe and the BalticsChadChileChinaColombiaComorosCongo, Dem. Rep.Congo, Rep.Costa RicaCote d'IvoireCroatiaCyprusCzech RepublicDenmarkDjiboutiDominicaDominican RepublicEarly-demographic dividendEast Asia & PacificEast Asia & Pacific (excluding high income)East Asia & Pacific (IDA & IBRD countries)EcuadorEgypt, Arab Rep.El SalvadorEquatorial GuineaEritreaEstoniaEthiopiaEuro areaEurope & Central AsiaEurope & Central Asia (excluding high income)Europe & Central Asia (IDA & IBRD countries)European UnionFijiFinlandFragile and conflict affected situationsFranceFrench PolynesiaGabonGambia, TheGeorgiaGermanyGhanaGreeceGrenadaGuatemalaGuineaGuinea-BissauGuyanaHaitiHeavily indebted poor countries (HIPC)High incomeHondurasHong Kong SAR, ChinaHungaryIBRD onlyIcelandIDA & IBRD totalIDA blendIDA onlyIDA totalIndiaIndonesiaIran, Islamic Rep.IraqIrelandIsraelItalyJamaicaJapanJordanKazakhstanKenyaKiribatiKorea, Rep.KosovoKuwaitKyrgyz RepublicLao PDRLate-demographic dividendLatin America & Caribbean Latin America & Caribbean (excluding high income)Latin America & the Caribbean (IDA & IBRD countries)LatviaLeast developed countries: UN classificationLebanonLesothoLiberiaLibyaLithuaniaLow & middle incomeLow incomeLower middle incomeLuxembourgMacao SAR, ChinaMacedonia, FYRMadagascarMalawiMalaysiaMaldivesMaliMaltaMarshall IslandsMauritaniaMauritiusMexicoMicronesia, Fed. Sts.Middle East & North AfricaMiddle East & North Africa (excluding high income)Middle East & North Africa (IDA & IBRD countries)Middle incomeMoldovaMongoliaMontenegroMoroccoMozambiqueMyanmarNamibiaNauruNepalNetherlandsNew CaledoniaNew ZealandNicaraguaNigerNigeriaNorth AmericaNorwayOECD membersOmanOther small statesPacific island small statesPakistanPalauPanamaPapua New GuineaParaguayPeruPhilippinesPolandPortugalPost-demographic dividendPre-demographic dividendQatarRomaniaRussian FederationRwandaSamoaSao Tome and PrincipeSaudi ArabiaSenegalSerbiaSeychellesSierra LeoneSingaporeSlovak RepublicSloveniaSmall statesSolomon IslandsSomaliaSouth AfricaSouth AsiaSouth Asia (IDA & IBRD)South SudanSpainSri LankaSt. Kitts and NevisSt. LuciaSt. Vincent and the GrenadinesSub-Saharan Africa Sub-Saharan Africa (excluding high income)Sub-Saharan Africa (IDA & IBRD countries)SudanSurinameSwazilandSwedenSwitzerlandSyrian Arab RepublicTajikistanTanzaniaThailandTimor-LesteTogoTongaTrinidad and TobagoTunisiaTurkeyTurkmenistanTuvaluUgandaUkraineUnited Arab EmiratesUnited KingdomUnited StatesUpper middle incomeUruguayUzbekistanVanuatuVenezuela, RBVietnamWest Bank and GazaWorldYemen, Rep.ZambiaZimbabwe Timeline:
This timeline shows a graph from 1973 to 2016 of Jordan. No data until 1972. Number of actual observations by date: 44.
Source name:
World Development Indicators
Source organization:
International Monetary Fund, International Financial Statistics and Balance of Payments databases, World Bank, International Debt Statistics, and World Bank and OECD GDP estimates.
Categories, topics:
Economy & Growth, Financial Sector, Climate Change
Last updated:
apr 23, 2017
Indicators value changes by year
Minimum:
-0.598
jan 1, 1994
Maximum:
23.537
jan 1, 2007
At the date of observation
Value
Absolute change
Change from previous value
jan 1, 1973
0.071
+0.071
0.0%
jan 1, 1974
0.226
+0.155
217.9%
jan 1, 1975
0.57
+0.345
152.67%
jan 1, 1976
1.881
+1.311
229.8%
jan 1, 1977
-0.441
-2.322
-123.43%
jan 1, 1978
0.536
+0.976
-221.54%
jan 1, 1979
2.168
+1.632
304.77%
jan 1, 1980
0.806
-1.362
-62.82%
jan 1, 1981
0.865
+0.059
7.34%
jan 1, 1982
3.211
+2.346
271.17%
jan 1, 1983
1.27
-1.942
-60.46%
jan 1, 1984
0.709
-0.561
-44.2%
jan 1, 1985
1.56
+0.852
120.18%
jan 1, 1986
0.5
-1.061
-67.98%
jan 1, 1987
0.355
-0.144
-28.85%
jan 1, 1988
0.585
+0.229
64.49%
jan 1, 1989
0.378
-0.207
-35.34%
jan 1, 1990
-0.032
-0.41
-108.46%
jan 1, 1991
0.905
+0.937
-2.93K%
jan 1, 1992
-0.274
-1.179
-130.24%
jan 1, 1993
0.767
+1.04
-380.19%
jan 1, 1994
-0.598
-1.365
-178.06%
jan 1, 1995
0.046
+0.644
-107.65%
jan 1, 1996
0.198
+0.152
332.24%
jan 1, 1997
0.224
+0.026
13.2%
jan 1, 1998
4.982
+4.758
2.12K%
jan 1, 1999
3.919
-1.063
-21.34%
jan 1, 2000
1.939
-1.98
-50.53%
jan 1, 2001
10.798
+8.859
456.91%
jan 1, 2002
3.049
-7.748
-71.76%
jan 1, 2003
2.487
-0.563
-18.46%
jan 1, 2004
5.366
+2.879
115.8%
jan 1, 2005
8.212
+2.846
53.04%
jan 1, 2006
15.764
+7.552
91.96%
jan 1, 2007
23.537
+7.773
49.31%
jan 1, 2008
15.325
-8.213
-34.89%
jan 1, 2009
12.865
-2.459
-16.05%
jan 1, 2010
10.131
-2.734
-21.25%
jan 1, 2011
6.389
-3.742
-36.93%
jan 1, 2012
5.153
-1.237
-19.35%
jan 1, 2013
4.891
-0.261
-5.07%
jan 1, 2014
5.375
+0.484
9.89%
jan 1, 2015
5.608
+0.233
4.34%
jan 1, 2016
3.398
-2.211
-39.41%
Ranking of countries by current statistics by years


Comments: