29
/
en
AIzaSyAYiBZKx7MnpbEhh9jyipgxe19OcubqV5w
April 1, 2024
103590
Chad
TCD
true
2
1
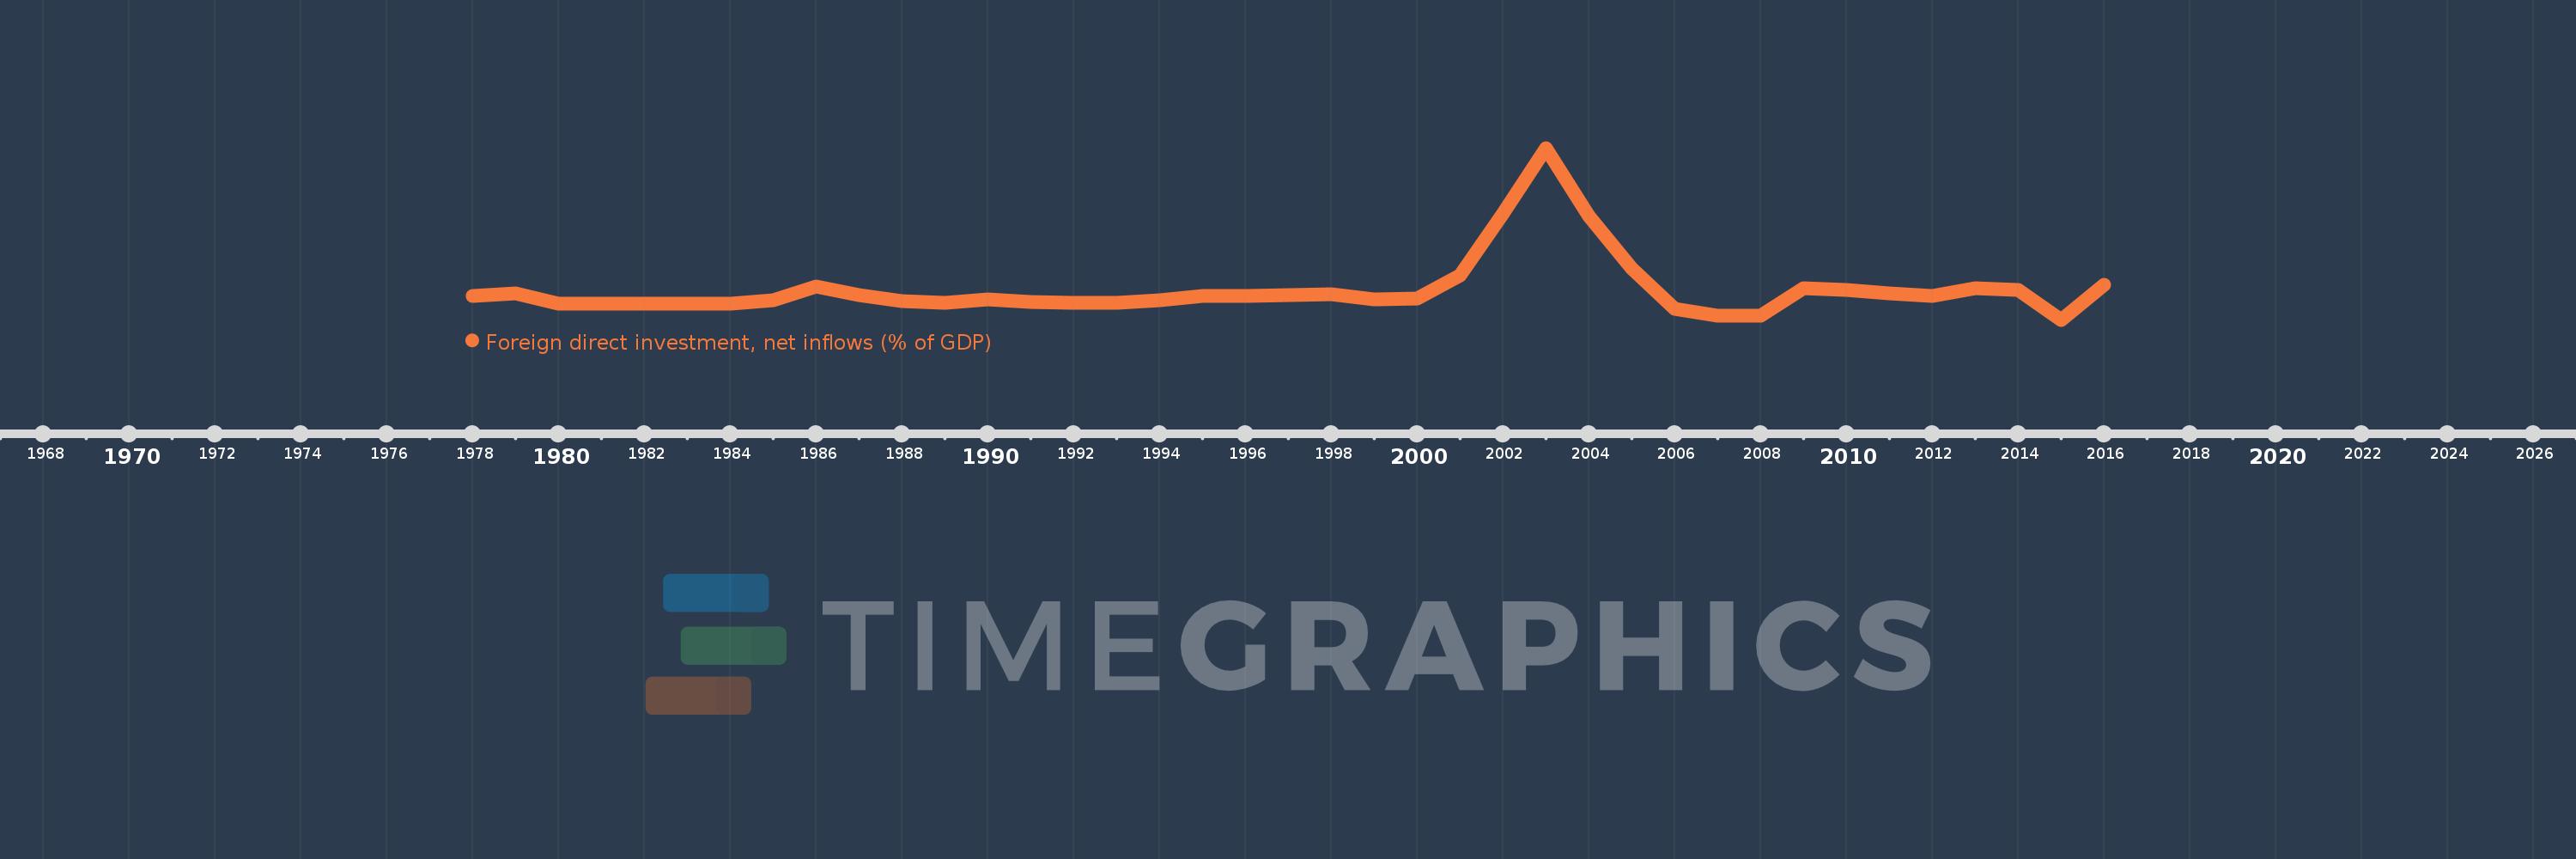
Foreign direct investment, net inflows (% of GDP)
2016,2015,2014,2013,2012,2011,2010,2009,2008,2007,2006,2005,2004,2003,2002,2001,2000,1999,1998,1997,1996,1995,1994,1993,1992,1991,1990,1989,1988,1987,1986,1985,1984,1983,1982,1981,1980,1979,1978
This statistics in other country:
AfghanistanAlbaniaAlgeriaAngolaAntigua and BarbudaArab WorldArgentinaArmeniaArubaAustraliaAustriaAzerbaijanBahamas, TheBahrainBangladeshBarbadosBelarusBelgiumBelizeBeninBermudaBhutanBoliviaBosnia and HerzegovinaBotswanaBrazilBrunei DarussalamBulgariaBurkina FasoBurundiCabo VerdeCambodiaCameroonCanadaCaribbean small statesCayman IslandsCentral African RepublicCentral Europe and the BalticsChadChileChinaColombiaComorosCongo, Dem. Rep.Congo, Rep.Costa RicaCote d'IvoireCroatiaCyprusCzech RepublicDenmarkDjiboutiDominicaDominican RepublicEarly-demographic dividendEast Asia & PacificEast Asia & Pacific (excluding high income)East Asia & Pacific (IDA & IBRD countries)EcuadorEgypt, Arab Rep.El SalvadorEquatorial GuineaEritreaEstoniaEthiopiaEuro areaEurope & Central AsiaEurope & Central Asia (excluding high income)Europe & Central Asia (IDA & IBRD countries)European UnionFijiFinlandFragile and conflict affected situationsFranceFrench PolynesiaGabonGambia, TheGeorgiaGermanyGhanaGreeceGrenadaGuatemalaGuineaGuinea-BissauGuyanaHaitiHeavily indebted poor countries (HIPC)High incomeHondurasHong Kong SAR, ChinaHungaryIBRD onlyIcelandIDA & IBRD totalIDA blendIDA onlyIDA totalIndiaIndonesiaIran, Islamic Rep.IraqIrelandIsraelItalyJamaicaJapanJordanKazakhstanKenyaKiribatiKorea, Rep.KosovoKuwaitKyrgyz RepublicLao PDRLate-demographic dividendLatin America & Caribbean Latin America & Caribbean (excluding high income)Latin America & the Caribbean (IDA & IBRD countries)LatviaLeast developed countries: UN classificationLebanonLesothoLiberiaLibyaLithuaniaLow & middle incomeLow incomeLower middle incomeLuxembourgMacao SAR, ChinaMacedonia, FYRMadagascarMalawiMalaysiaMaldivesMaliMaltaMarshall IslandsMauritaniaMauritiusMexicoMicronesia, Fed. Sts.Middle East & North AfricaMiddle East & North Africa (excluding high income)Middle East & North Africa (IDA & IBRD countries)Middle incomeMoldovaMongoliaMontenegroMoroccoMozambiqueMyanmarNamibiaNauruNepalNetherlandsNew CaledoniaNew ZealandNicaraguaNigerNigeriaNorth AmericaNorwayOECD membersOmanOther small statesPacific island small statesPakistanPalauPanamaPapua New GuineaParaguayPeruPhilippinesPolandPortugalPost-demographic dividendPre-demographic dividendQatarRomaniaRussian FederationRwandaSamoaSao Tome and PrincipeSaudi ArabiaSenegalSerbiaSeychellesSierra LeoneSingaporeSlovak RepublicSloveniaSmall statesSolomon IslandsSomaliaSouth AfricaSouth AsiaSouth Asia (IDA & IBRD)South SudanSpainSri LankaSt. Kitts and NevisSt. LuciaSt. Vincent and the GrenadinesSub-Saharan Africa Sub-Saharan Africa (excluding high income)Sub-Saharan Africa (IDA & IBRD countries)SudanSurinameSwazilandSwedenSwitzerlandSyrian Arab RepublicTajikistanTanzaniaThailandTimor-LesteTogoTongaTrinidad and TobagoTunisiaTurkeyTurkmenistanTuvaluUgandaUkraineUnited Arab EmiratesUnited KingdomUnited StatesUpper middle incomeUruguayUzbekistanVanuatuVenezuela, RBVietnamWest Bank and GazaWorldYemen, Rep.ZambiaZimbabwe Timeline:
This timeline shows a graph from 1978 to 2016 of Chad. No data until 1977. Number of actual observations by date: 39.
Source name:
World Development Indicators
Source organization:
International Monetary Fund, International Financial Statistics and Balance of Payments databases, World Bank, International Debt Statistics, and World Bank and OECD GDP estimates.
Categories, topics:
Economy & Growth, Financial Sector, Climate Change
Last updated:
apr 23, 2017
Indicators value changes by year
Minimum:
-4.852
jan 1, 2015
Maximum:
46.494
jan 1, 2003
At the date of observation
Value
Absolute change
Change from previous value
jan 1, 1978
2.262
+2.262
0.0%
jan 1, 1979
3.064
+0.803
35.5%
jan 1, 1980
-0.128
-3.193
-104.19%
jan 1, 1981
-0.042
+0.087
-67.59%
jan 1, 1982
-0.013
+0.029
-69.87%
jan 1, 1983
-0.014
-0.002
14.66%
jan 1, 1984
-0.011
+0.004
-24.82%
jan 1, 1985
0.999
+1.01
-9.34K%
jan 1, 1986
5.193
+4.194
419.6%
jan 1, 1987
2.641
-2.552
-49.15%
jan 1, 1988
0.702
-1.939
-73.44%
jan 1, 1989
0.087
-0.615
-87.6%
jan 1, 1990
1.307
+1.22
1.4K%
jan 1, 1991
0.541
-0.766
-58.64%
jan 1, 1992
0.226
-0.315
-58.23%
jan 1, 1993
0.104
-0.122
-53.87%
jan 1, 1994
1.036
+0.932
894.41%
jan 1, 1995
2.295
+1.259
121.48%
jan 1, 1996
2.255
-0.039
-1.72%
jan 1, 1997
2.455
+0.2
8.87%
jan 1, 1998
2.867
+0.412
16.79%
jan 1, 1999
1.244
-1.624
-56.63%
jan 1, 2000
1.598
+0.355
28.51%
jan 1, 2001
8.315
+6.717
420.34%
jan 1, 2002
26.903
+18.588
223.53%
jan 1, 2003
46.494
+19.591
72.82%
jan 1, 2004
26.041
-20.452
-43.99%
jan 1, 2005
10.573
-15.468
-59.4%
jan 1, 2006
-1.495
-12.068
-114.14%
jan 1, 2007
-3.751
-2.257
150.98%
jan 1, 2008
-3.723
+0.028
-0.74%
jan 1, 2009
4.503
+8.226
-220.93%
jan 1, 2010
4.051
-0.451
-10.02%
jan 1, 2011
2.937
-1.115
-27.51%
jan 1, 2012
2.319
-0.618
-21.04%
jan 1, 2013
4.688
+2.369
102.15%
jan 1, 2014
4.017
-0.671
-14.31%
jan 1, 2015
-4.852
-8.869
-220.79%
jan 1, 2016
5.512
+10.365
-213.6%
Ranking of countries by current statistics by years


Comments: