29
/
en
AIzaSyAYiBZKx7MnpbEhh9jyipgxe19OcubqV5w
April 1, 2024
186496
Malawi
MWI
true
2
1
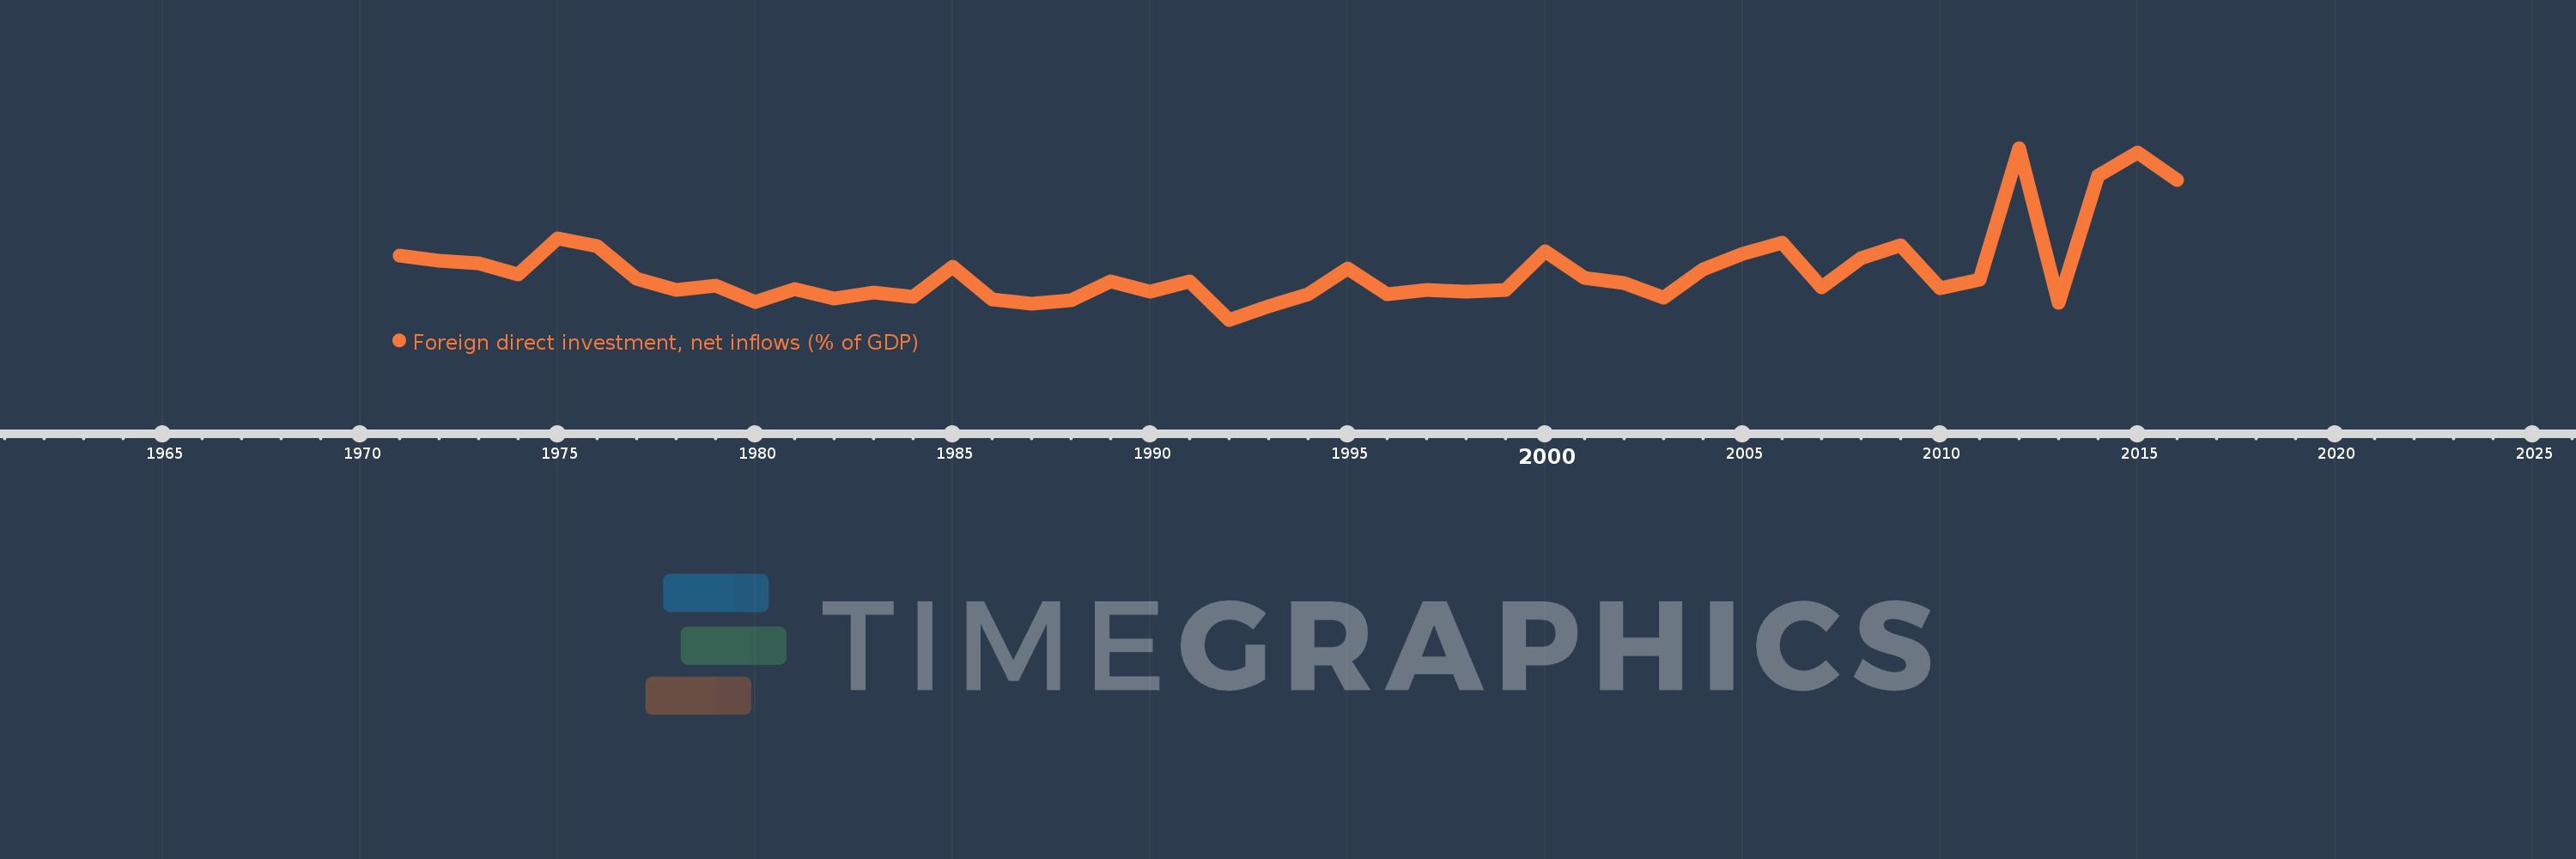
Foreign direct investment, net inflows (% of GDP)
2016,2015,2014,2013,2012,2011,2010,2009,2008,2007,2006,2005,2004,2003,2002,2001,2000,1999,1998,1997,1996,1995,1994,1993,1992,1991,1990,1989,1988,1987,1986,1985,1984,1983,1982,1981,1980,1979,1978,1977,1976,1975,1974,1973,1972,1971
This statistics in other country:
AfghanistanAlbaniaAlgeriaAngolaAntigua and BarbudaArab WorldArgentinaArmeniaArubaAustraliaAustriaAzerbaijanBahamas, TheBahrainBangladeshBarbadosBelarusBelgiumBelizeBeninBermudaBhutanBoliviaBosnia and HerzegovinaBotswanaBrazilBrunei DarussalamBulgariaBurkina FasoBurundiCabo VerdeCambodiaCameroonCanadaCaribbean small statesCayman IslandsCentral African RepublicCentral Europe and the BalticsChadChileChinaColombiaComorosCongo, Dem. Rep.Congo, Rep.Costa RicaCote d'IvoireCroatiaCyprusCzech RepublicDenmarkDjiboutiDominicaDominican RepublicEarly-demographic dividendEast Asia & PacificEast Asia & Pacific (excluding high income)East Asia & Pacific (IDA & IBRD countries)EcuadorEgypt, Arab Rep.El SalvadorEquatorial GuineaEritreaEstoniaEthiopiaEuro areaEurope & Central AsiaEurope & Central Asia (excluding high income)Europe & Central Asia (IDA & IBRD countries)European UnionFijiFinlandFragile and conflict affected situationsFranceFrench PolynesiaGabonGambia, TheGeorgiaGermanyGhanaGreeceGrenadaGuatemalaGuineaGuinea-BissauGuyanaHaitiHeavily indebted poor countries (HIPC)High incomeHondurasHong Kong SAR, ChinaHungaryIBRD onlyIcelandIDA & IBRD totalIDA blendIDA onlyIDA totalIndiaIndonesiaIran, Islamic Rep.IraqIrelandIsraelItalyJamaicaJapanJordanKazakhstanKenyaKiribatiKorea, Rep.KosovoKuwaitKyrgyz RepublicLao PDRLate-demographic dividendLatin America & Caribbean Latin America & Caribbean (excluding high income)Latin America & the Caribbean (IDA & IBRD countries)LatviaLeast developed countries: UN classificationLebanonLesothoLiberiaLibyaLithuaniaLow & middle incomeLow incomeLower middle incomeLuxembourgMacao SAR, ChinaMacedonia, FYRMadagascarMalawiMalaysiaMaldivesMaliMaltaMarshall IslandsMauritaniaMauritiusMexicoMicronesia, Fed. Sts.Middle East & North AfricaMiddle East & North Africa (excluding high income)Middle East & North Africa (IDA & IBRD countries)Middle incomeMoldovaMongoliaMontenegroMoroccoMozambiqueMyanmarNamibiaNauruNepalNetherlandsNew CaledoniaNew ZealandNicaraguaNigerNigeriaNorth AmericaNorwayOECD membersOmanOther small statesPacific island small statesPakistanPalauPanamaPapua New GuineaParaguayPeruPhilippinesPolandPortugalPost-demographic dividendPre-demographic dividendQatarRomaniaRussian FederationRwandaSamoaSao Tome and PrincipeSaudi ArabiaSenegalSerbiaSeychellesSierra LeoneSingaporeSlovak RepublicSloveniaSmall statesSolomon IslandsSomaliaSouth AfricaSouth AsiaSouth Asia (IDA & IBRD)South SudanSpainSri LankaSt. Kitts and NevisSt. LuciaSt. Vincent and the GrenadinesSub-Saharan Africa Sub-Saharan Africa (excluding high income)Sub-Saharan Africa (IDA & IBRD countries)SudanSurinameSwazilandSwedenSwitzerlandSyrian Arab RepublicTajikistanTanzaniaThailandTimor-LesteTogoTongaTrinidad and TobagoTunisiaTurkeyTurkmenistanTuvaluUgandaUkraineUnited Arab EmiratesUnited KingdomUnited StatesUpper middle incomeUruguayUzbekistanVanuatuVenezuela, RBVietnamWest Bank and GazaWorldYemen, Rep.ZambiaZimbabwe Timeline:
This timeline shows a graph from 1971 to 2016 of Malawi. No data until 1970. Number of actual observations by date: 46.
Source name:
World Development Indicators
Source organization:
International Monetary Fund, International Financial Statistics and Balance of Payments databases, World Bank, International Debt Statistics, and World Bank and OECD GDP estimates.
Categories, topics:
Economy & Growth, Financial Sector, Climate Change
Last updated:
apr 23, 2017
Indicators value changes by year
Minimum:
-1.302
jan 1, 1992
At the date of observation
Value
Absolute change
Change from previous value
jan 1, 1971
2.96
+2.96
0.0%
jan 1, 1972
2.627
-0.333
-11.24%
jan 1, 1973
2.487
-0.14
-5.33%
jan 1, 1974
1.733
-0.754
-30.32%
jan 1, 1975
4.138
+2.405
138.75%
jan 1, 1976
3.606
-0.532
-12.86%
jan 1, 1977
1.447
-2.159
-59.87%
jan 1, 1978
0.687
-0.76
-52.54%
jan 1, 1979
0.962
+0.275
40.02%
jan 1, 1980
-0.116
-1.077
-112.03%
jan 1, 1981
0.766
+0.882
-762.29%
jan 1, 1982
0.09
-0.676
-88.22%
jan 1, 1983
0.508
+0.418
463.4%
jan 1, 1984
0.209
-0.3
-58.94%
jan 1, 1985
2.259
+2.05
982.09%
jan 1, 1986
0.046
-2.213
-97.95%
jan 1, 1987
-0.248
-0.294
-634.92%
jan 1, 1988
0.008
+0.255
-103.09%
jan 1, 1989
1.264
+1.256
16.41K%
jan 1, 1990
0.584
-0.68
-53.78%
jan 1, 1991
1.239
+0.655
112.06%
jan 1, 1992
-1.302
-2.541
-205.13%
jan 1, 1993
-0.395
+0.908
-69.71%
jan 1, 1994
0.386
+0.781
-197.92%
jan 1, 1995
2.115
+1.728
447.37%
jan 1, 1996
0.404
-1.711
-80.91%
jan 1, 1997
0.693
+0.289
71.51%
jan 1, 1998
0.558
-0.134
-19.39%
jan 1, 1999
0.691
+0.133
23.85%
jan 1, 2000
3.296
+2.604
376.64%
jan 1, 2001
1.491
-1.804
-54.75%
jan 1, 2002
1.124
-0.367
-24.6%
jan 1, 2003
0.169
-0.956
-84.99%
jan 1, 2004
2.053
+1.884
1.12K%
jan 1, 2005
3.101
+1.048
51.06%
jan 1, 2006
3.821
+0.72
23.21%
jan 1, 2007
0.889
-2.932
-76.72%
jan 1, 2008
2.807
+1.917
215.57%
jan 1, 2009
3.673
+0.866
30.84%
jan 1, 2010
0.793
-2.88
-78.41%
jan 1, 2011
1.394
+0.601
75.82%
jan 1, 2012
10.18
+8.786
630.12%
jan 1, 2013
-0.149
-10.329
-101.46%
jan 1, 2014
8.309
+8.458
-5.69K%
jan 1, 2015
9.877
+1.568
18.87%
jan 1, 2016
8.047
-1.83
-18.53%
Ranking of countries by current statistics by years


Comments: