29
/
en
AIzaSyAYiBZKx7MnpbEhh9jyipgxe19OcubqV5w
April 1, 2024
251875
St. Vincent and the Grenadines
VCT
true
2
1
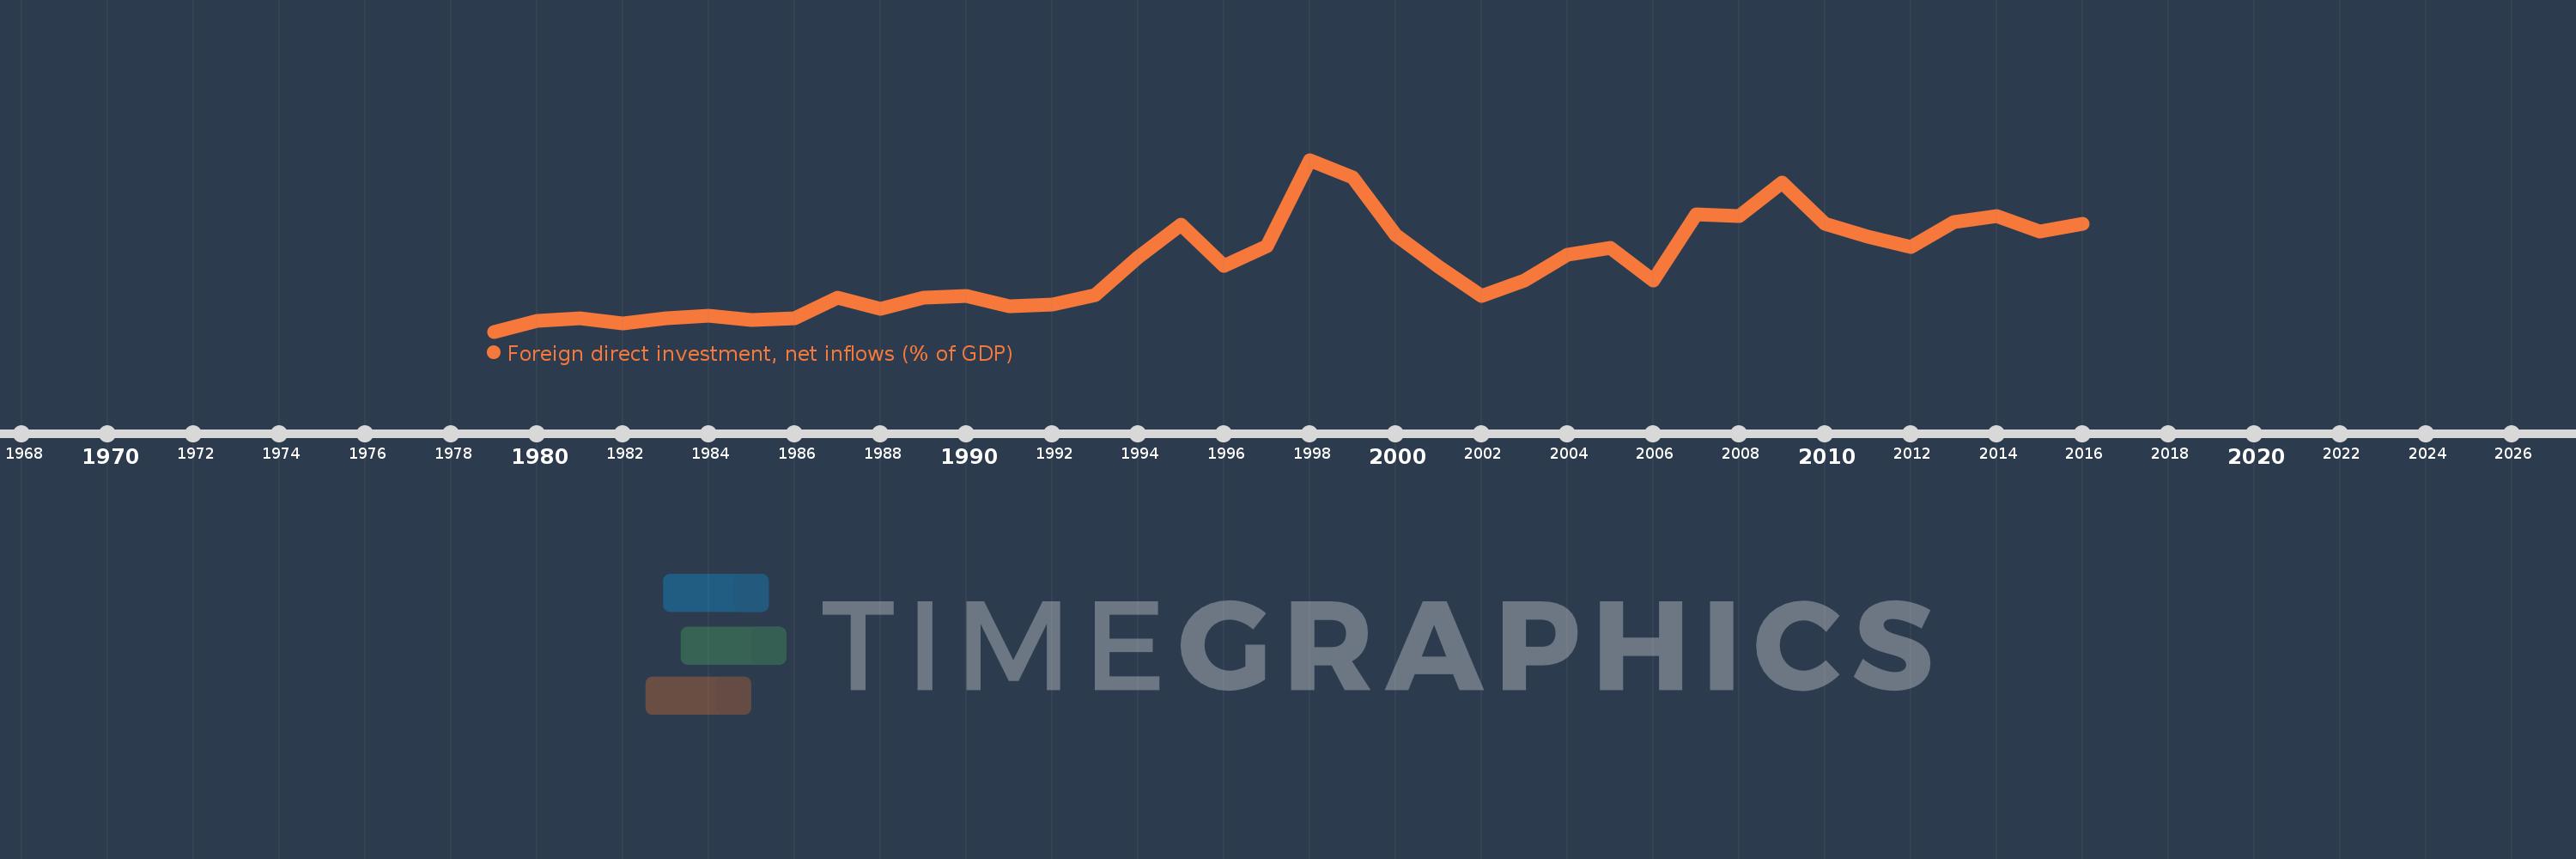
Foreign direct investment, net inflows (% of GDP)
2016,2015,2014,2013,2012,2011,2010,2009,2008,2007,2006,2005,2004,2003,2002,2001,2000,1999,1998,1997,1996,1995,1994,1993,1992,1991,1990,1989,1988,1987,1986,1985,1984,1983,1982,1981,1980,1979
This statistics in other country:
AfghanistanAlbaniaAlgeriaAngolaAntigua and BarbudaArab WorldArgentinaArmeniaArubaAustraliaAustriaAzerbaijanBahamas, TheBahrainBangladeshBarbadosBelarusBelgiumBelizeBeninBermudaBhutanBoliviaBosnia and HerzegovinaBotswanaBrazilBrunei DarussalamBulgariaBurkina FasoBurundiCabo VerdeCambodiaCameroonCanadaCaribbean small statesCayman IslandsCentral African RepublicCentral Europe and the BalticsChadChileChinaColombiaComorosCongo, Dem. Rep.Congo, Rep.Costa RicaCote d'IvoireCroatiaCyprusCzech RepublicDenmarkDjiboutiDominicaDominican RepublicEarly-demographic dividendEast Asia & PacificEast Asia & Pacific (excluding high income)East Asia & Pacific (IDA & IBRD countries)EcuadorEgypt, Arab Rep.El SalvadorEquatorial GuineaEritreaEstoniaEthiopiaEuro areaEurope & Central AsiaEurope & Central Asia (excluding high income)Europe & Central Asia (IDA & IBRD countries)European UnionFijiFinlandFragile and conflict affected situationsFranceFrench PolynesiaGabonGambia, TheGeorgiaGermanyGhanaGreeceGrenadaGuatemalaGuineaGuinea-BissauGuyanaHaitiHeavily indebted poor countries (HIPC)High incomeHondurasHong Kong SAR, ChinaHungaryIBRD onlyIcelandIDA & IBRD totalIDA blendIDA onlyIDA totalIndiaIndonesiaIran, Islamic Rep.IraqIrelandIsraelItalyJamaicaJapanJordanKazakhstanKenyaKiribatiKorea, Rep.KosovoKuwaitKyrgyz RepublicLao PDRLate-demographic dividendLatin America & Caribbean Latin America & Caribbean (excluding high income)Latin America & the Caribbean (IDA & IBRD countries)LatviaLeast developed countries: UN classificationLebanonLesothoLiberiaLibyaLithuaniaLow & middle incomeLow incomeLower middle incomeLuxembourgMacao SAR, ChinaMacedonia, FYRMadagascarMalawiMalaysiaMaldivesMaliMaltaMarshall IslandsMauritaniaMauritiusMexicoMicronesia, Fed. Sts.Middle East & North AfricaMiddle East & North Africa (excluding high income)Middle East & North Africa (IDA & IBRD countries)Middle incomeMoldovaMongoliaMontenegroMoroccoMozambiqueMyanmarNamibiaNauruNepalNetherlandsNew CaledoniaNew ZealandNicaraguaNigerNigeriaNorth AmericaNorwayOECD membersOmanOther small statesPacific island small statesPakistanPalauPanamaPapua New GuineaParaguayPeruPhilippinesPolandPortugalPost-demographic dividendPre-demographic dividendQatarRomaniaRussian FederationRwandaSamoaSao Tome and PrincipeSaudi ArabiaSenegalSerbiaSeychellesSierra LeoneSingaporeSlovak RepublicSloveniaSmall statesSolomon IslandsSomaliaSouth AfricaSouth AsiaSouth Asia (IDA & IBRD)South SudanSpainSri LankaSt. Kitts and NevisSt. LuciaSt. Vincent and the GrenadinesSub-Saharan Africa Sub-Saharan Africa (excluding high income)Sub-Saharan Africa (IDA & IBRD countries)SudanSurinameSwazilandSwedenSwitzerlandSyrian Arab RepublicTajikistanTanzaniaThailandTimor-LesteTogoTongaTrinidad and TobagoTunisiaTurkeyTurkmenistanTuvaluUgandaUkraineUnited Arab EmiratesUnited KingdomUnited StatesUpper middle incomeUruguayUzbekistanVanuatuVenezuela, RBVietnamWest Bank and GazaWorldYemen, Rep.ZambiaZimbabwe Timeline:
This timeline shows a graph from 1979 to 2016 of St. Vincent and the Grenadines. No data until 1978. Number of actual observations by date: 38.
Source name:
World Development Indicators
Source organization:
International Monetary Fund, International Financial Statistics and Balance of Payments databases, World Bank, International Debt Statistics, and World Bank and OECD GDP estimates.
Categories, topics:
Economy & Growth, Financial Sector, Climate Change
Last updated:
apr 23, 2017
Indicators value changes by year
Minimum:
-0.822
jan 1, 1979
At the date of observation
Value
Absolute change
Change from previous value
jan 1, 1979
-0.822
-0.822
0.0%
jan 1, 1980
0.844
+1.666
-202.7%
jan 1, 1981
1.336
+0.492
58.3%
jan 1, 1982
0.49
-0.846
-63.34%
jan 1, 1983
1.319
+0.829
169.22%
jan 1, 1984
1.718
+0.399
30.27%
jan 1, 1985
1.037
-0.681
-39.64%
jan 1, 1986
1.236
+0.199
19.2%
jan 1, 1987
4.582
+3.346
270.76%
jan 1, 1988
2.827
-1.756
-38.31%
jan 1, 1989
4.539
+1.712
60.58%
jan 1, 1990
4.933
+0.394
8.67%
jan 1, 1991
3.19
-1.743
-35.34%
jan 1, 1992
3.491
+0.301
9.45%
jan 1, 1993
5.001
+1.51
43.25%
jan 1, 1994
10.967
+5.966
119.31%
jan 1, 1995
16.209
+5.242
47.79%
jan 1, 1996
9.696
-6.513
-40.18%
jan 1, 1997
12.864
+3.168
32.68%
jan 1, 1998
26.59
+13.725
106.69%
jan 1, 1999
23.808
-2.781
-10.46%
jan 1, 2000
14.536
-9.272
-38.94%
jan 1, 2001
9.525
-5.011
-34.48%
jan 1, 2002
4.893
-4.632
-48.63%
jan 1, 2003
7.372
+2.479
50.67%
jan 1, 2004
11.45
+4.078
55.32%
jan 1, 2005
12.584
+1.135
9.91%
jan 1, 2006
7.279
-5.305
-42.16%
jan 1, 2007
17.864
+10.586
145.43%
jan 1, 2008
17.603
-0.261
-1.46%
jan 1, 2009
22.899
+5.295
30.08%
jan 1, 2010
16.331
-6.568
-28.68%
jan 1, 2011
14.271
-2.06
-12.61%
jan 1, 2012
12.664
-1.607
-11.26%
jan 1, 2013
16.654
+3.99
31.51%
jan 1, 2014
17.573
+0.918
5.51%
jan 1, 2015
15.086
-2.487
-14.15%
jan 1, 2016
16.368
+1.282
8.5%
Ranking of countries by current statistics by years


Comments: